
How AI Infrastructure Capex Sustains US Economic Growth
The Economic Impact of AI Infrastructure Capex
The unprecedented surge in AI Infrastructure Capex has evolved from a sector-specific trend into the primary load-bearing pillar of broader US economic growth. This massive wave of corporate capital expenditure is effectively sustaining headline gross domestic product (GDP), masking a growing vulnerability in the traditional economy. Investors are currently navigating a stark macroeconomic divergence, where aggressive technology and industrial spending offsets a slowing consumer base.
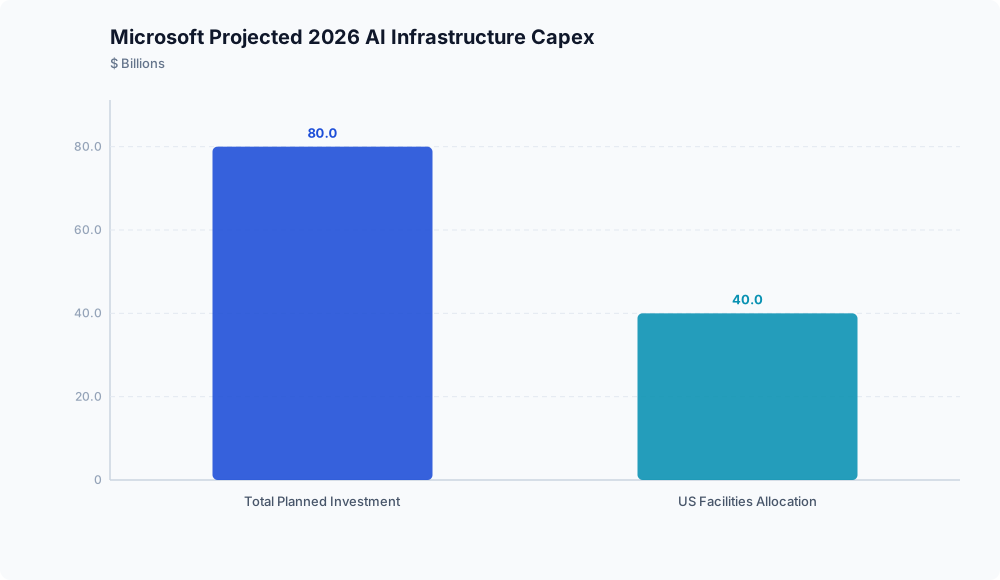
The catalyst forcing the market to recognize this shift is the sheer scale of corporate commitments. This is highlighted by Microsoft’s projected $80 billion AI infrastructure investment for 2026, with approximately half earmarked specifically for US facilities, according to build.inc. This is not a temporary cyclical peak; it is a permanent structural shift.
Market participants relying solely on aggregate GDP figures risk mispricing the underlying fragility of non-technology sectors. The implication is a highly bifurcated equity market where returns are increasingly concentrated in the firms building, powering, and housing artificial intelligence compute. For investors, the thesis is clear: the broader economy is now tethered to the physical realization of digital ambitions, and identifying the bottlenecks in this build-out is the key to capturing future alpha.
The Transmission Chain: From Corporate Intent to Physical Bottlenecks
The transmission of capital from corporate balance sheets to physical infrastructure is accelerating at a historic scale, driven entirely by the computational demands of artificial intelligence. Financial commitments are instantly allocated, but the physical realization of these investments is colliding with severe supply-side bottlenecks.
Concrete, steel, specialized cooling systems, and fiber-optic networks require years to deploy. This creates a distinct transmission chain where financial intent inevitably manifests as physical and operational constraints across the broader economy.
This bottleneck creates a systematic flow from corporate intent to downstream market impacts, allowing investors to identify lucrative second-order opportunities. By tracking the progression from capital allocation to infrastructure limits, market participants can anticipate where pricing power will concentrate next.
The following table illustrates this transmission from initial capital expenditure surges to localized constraints and structural market shifts:
| Event (Capex Surge) | Mechanism (Power/Inventory Constraints) | Market Effect (Utility/Industrial Tailwinds) |
|---|---|---|
| $800B projected 2026 developer capex | Sub-3% vacancy in primary market hubs | Sustained pricing power for legacy DC operators |
| Hyperscale facility expansion | Regional grid capacity exhaustion | Premium lease rates exceeding $200/kW/month |
| $2T projected investment by 2030 | Inadequate legacy power infrastructure | Forced structural shifts in utility operating models |
The immediate consequence of this supply-demand mismatch is a drastic repricing of available space and power. The flow of capital is physically reshaping the American industrial landscape, creating an easily visualized split in the domestic economy. On one side, sprawling, multi-billion-dollar hyperscale construction sites teem with industrial activity. On the other, retail corridors remain increasingly quiet, reflecting sluggish consumer growth.
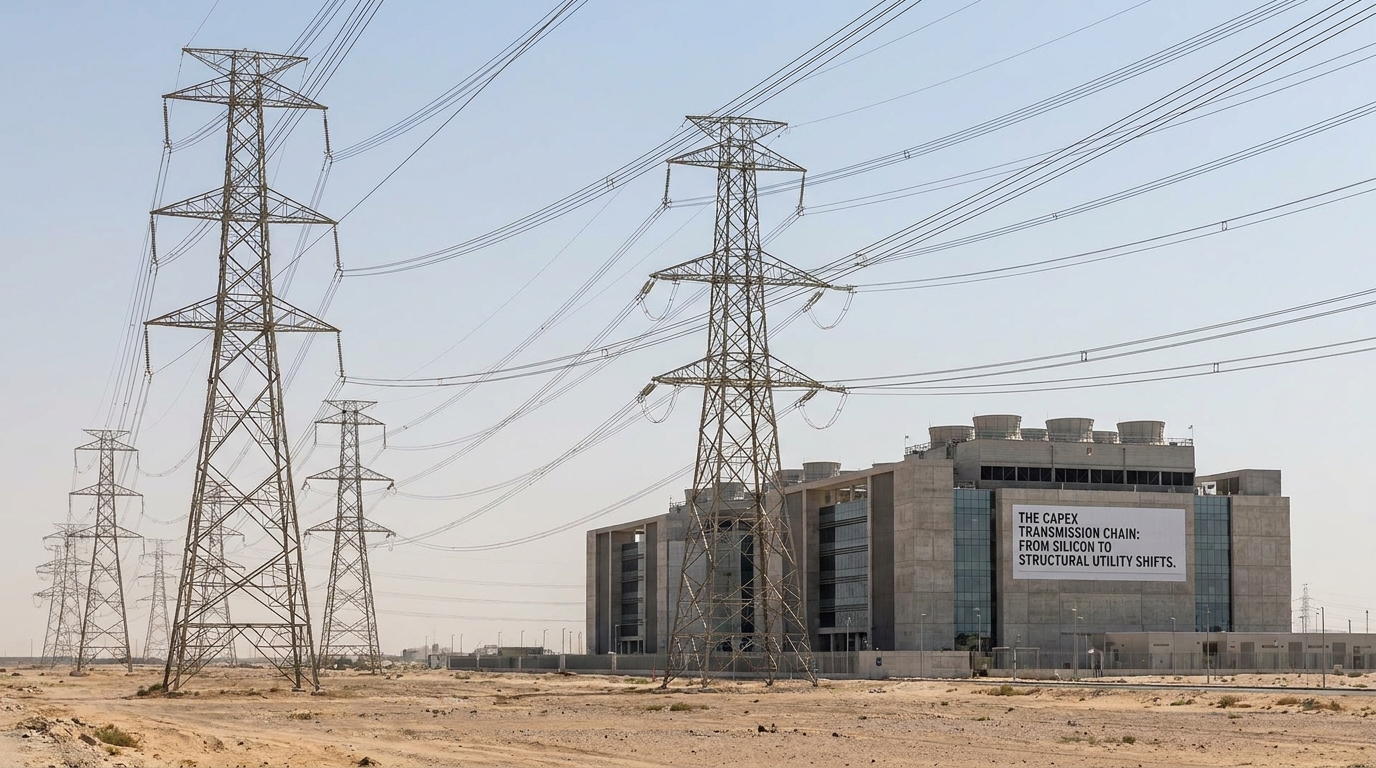
Ultimately, the terminal bottleneck in this transmission chain is the electrical grid. The rapid expansion of these facilities is actively forcing utility and infrastructure firms across the US, UK, and Middle East to fundamentally rethink their operating models to handle unprecedented power draws, according to LinkedIn.
The shift implies a transition from slow-growth dividend models to aggressive capital expenditure frameworks for utilities. For US investors, this signals a structural tailwind for grid modernization, electrical equipment manufacturers, and independent power producers, who must bridge the gap between digital ambitions and physical grid realities.
The Highest-Signal Evidence: Unprecedented Capital Meets Physical Reality
The most critical data points from recent market activity highlight a scale of investment that rivals traditional heavy industry and national infrastructure projects. According to industry projections shared on LinkedIn, capital spending by major data center developers is expected to reach $800 billion in 2026 to support AI computational requirements.
To contextualize this magnitude, this single-year infrastructure investment projection now rivals the combined capital expenditures of all non-technology companies within the S&P 500.
The hyperscalers are driving this volume. Microsoft, Google, Meta, and Amazon have collectively committed over $300 billion in infrastructure capex across their 2025 and 2026 guidance, according to build.inc. The sheer volume of guaranteed spending creates a highly visible pipeline for downstream industries.
However, looking ahead, the projected spending figures suggest a steep curve that requires careful interpretation. S&P Global projects that average spending on US data center construction will exceed $70 billion per quarter from 2025 through 2028. Yet, US data center construction starts are projected to more than double from $11 billion in 2023 to $25 billion in 2025, according to build.inc.
This massive discrepancy between projected $25 billion in annual construction starts and over $280 billion in expected annualized spending reveals a critical analytical insight. The initial cost of physical building construction is only a fraction of the total capitalized cost. Equipping modern data centers with specialized high-density power infrastructure, liquid cooling systems, and advanced AI hardware vastly multiplies the total expenditure beyond the underlying real estate value.
The physical reality of this build-out is currently colliding with severe supply constraints, fundamentally altering the economics of data center leasing. By the first quarter of 2026, primary market data center vacancy rates are projected to plummet to approximately 2.8%, with absorption expected to consistently outpace new deliveries, according to build.inc.
This anticipated scarcity is exacerbated by severe power constraints in key hubs like Northern Virginia, Dallas, and Chicago, which are forecast to drive lease rates for available inventory above $200/kW/month.
For commercial real estate investors, data centers have transitioned from a niche alternative asset into a critical, high-yield property class. The second-order effect here is that access to compute is becoming a physical real estate bottleneck, potentially locking smaller enterprises out of the AI transition due to prohibitive infrastructure costs.
Forward-Looking Scenarios: Navigating the Bifurcated Economy
The sheer scale of this spending has fundamentally altered the macroeconomic landscape, forcing investors to evaluate how long this capital expenditure cycle can last. The tension between unlimited corporate capital and limited physical capacity necessitates mapping out three distinct forward-looking scenarios to navigate the associated risks.
In our base case scenario, sustained AI capital expenditures act as a pillar for headline GDP, but simultaneously widen the equity market gap. Heavyweight commitments provide a reliable floor for industrial and construction activity. Yet, this concentration of capital effectively creates a two-tiered economy where infrastructure providers and mega-cap tech firms absorb the bulk of institutional liquidity. Consequently, this localized economic engine masks underlying stagnation in traditional consumer and manufacturing sectors. Investors should expect market breadth to remain exceptionally narrow as the premium placed on AI-adjacent cash flows leaves non-tech equities starved for capital.
The upside scenario hinges on rapid, widespread commercial monetization of AI applications, which would justify extending the capex cycle and lifting broader market margins. If corporate adoption of AI tools yields tangible productivity gains, the return on investment will validate the aggressive build-out projections. This acceleration would allow infrastructure benefits to trickle down, transforming AI from a concentrated capital sink into a deflationary tool that boosts profitability across smaller capitalization indices. However, this scenario remains highly dependent on software revenue catching up to hardware expenditures, an outcome that is currently unproven and carries significant execution risk.
Conversely, the downside scenario materializes if severe power constraints trigger a sudden capex pullback, thereby exposing underlying macroeconomic weaknesses. The physical limits of the US power grid are already evident. If utility firms cannot adapt their operating models quickly enough to supply these energy-intensive facilities, Big Tech will be forced to pause its aggressive deployment schedules. A sudden halt to this $300 billion spending wave would immediately remove a critical prop from US GDP growth. Without the insulating effect of data center construction and semiconductor orders, broader consumer fatigue and corporate margin pressures would likely drag the broader indices lower.
Navigating these scenarios requires precisely distinguishing between verified capital commitments and speculative long-term forecasts. The table below delineates the verified market realities from the unresolved risks, providing a framework for allocating capital amid this historic infrastructure cycle.
| Category | Verified Market Facts | Future Uncertainty & ROI Risks |
|---|---|---|
| Capital Commitments | Big Tech has committed >$300B in 2025/2026 capex, including Microsoft’s projected $80B AI investment. | Whether software monetization will accelerate fast enough to justify extending capex beyond 2026. |
| Physical Constraints | Q1 2026 primary market vacancy is projected at ~2.8%, with lease rates expected to exceed $200/kW/month. | How utility firms will adapt operating models to resolve severe regional power shortages. |
| Construction Volume | US data center starts are projected to reach $25B in 2025, up from $11B in 2023. | Reconciling projected $25B annual starts with S&P Global’s projection of >$70B/quarter spending through 2028. |
| Macro Impact | AI infrastructure spending acts as a localized economic engine supporting headline GDP. | The risk of a sudden capex pullback exposing underlying consumer weakness if grid limits halt builds. |
What to Watch Next: Concrete Indicators and Triggers

To navigate this complex intersection of technology capital and physical constraints, investors must monitor a specific checklist of leading indicators. Relying on aggregate economic data will obscure the underlying mechanics of this two-tiered economy. Market participants should focus on the following concrete triggers:
- Primary Market Lease Rates: Track data center lease pricing in hubs like Northern Virginia, Dallas, and Chicago. Sustained pricing above the current $200/kW/month threshold will signal that power bottlenecks are worsening. If these rates continue to climb, it indicates that operators with energized capacity hold absolute pricing power, but it also threatens to compress the operating margins of the AI developers footing the bill.
- Utility Capital Expenditure Revisions: Watch for structural shifts in the forward guidance of regulated utilities and independent power producers. Utility capital expenditure revisions will serve as the primary trigger indicating whether grid operators are actually moving to resolve these structural power deficits. A transition toward aggressive capex frameworks in the utility sector will validate the projected $2 trillion data center investment pipeline estimated by Brookfield by 2030, according to LinkedIn.
- Infrastructure Metrics vs. Consumption Growth: Investors must continuously cross-reference industrial construction and semiconductor orders against monthly business-to-consumer (B2C) consumption growth metrics. With consumer growth currently sluggish, any deceleration in B2B tech spending without a corresponding rebound in consumer health will signal an impending macroeconomic contraction. Only by monitoring both sides of this equation can market participants gauge whether the historic tech cycle can continue masking broader economic fragility.
Conclusion
The US economy is currently being reshaped by a profound divergence in capital flows, heavily weighted toward the digital future at the expense of traditional consumer sectors. The staggering $800 billion projected for data center developer spending in 2026 is not merely a technology sector statistic; it is the dominant force keeping aggregate US economic growth afloat. However, this capital deployment is colliding with the physical realities of real estate scarcity and an antiquated electrical grid.
For investors, the analytical takeaway is that traditional broad-market diversification may introduce hidden risks if capital is trapped in consumer-facing laggards experiencing margin compression. The next phase of equity outperformance will likely shift away from the initial semiconductor designers and toward the industrial, electrical, and utility companies tasked with keeping this massive engine running.
Ultimately, until power constraints are resolved and consumer wage growth accelerates, the market will continue to disproportionately reward the enablers of AI Infrastructure Capex over consumer-dependent enterprises.
Disclaimer: This analysis is for informational purposes only and does not constitute investment, financial, real estate, or legal advice. Always consult a licensed financial advisor before making investment decisions.
FAQ
How is the surge in AI infrastructure capex directly impacting utility and industrial stocks? The surge is forcing utility and industrial firms to fundamentally rethink their operating models to handle unprecedented power draws. With an estimated $2 trillion flowing into data center development by 2030, utility companies are transitioning from slow-growth dividend models to aggressive capital expenditure frameworks to modernize the grid. This creates structural multi-year tailwinds for electrical equipment manufacturers, cooling providers, and independent power producers.
Why are consumer discretionary stocks facing margin compression despite strong headline US GDP growth? Headline GDP is being heavily supported by massive business-to-business technology and infrastructure investments, masking a sluggish business-to-consumer expansion. As operational costs remain sticky and consumer price sensitivity heightens among a fatigued middle class, discretionary companies lack the structural tailwinds propelling the tech sector and are struggling to pass on expenses, leading to margin compression.
What happens to the broader equity market if data center power constraints halt new construction? If severe regional power constraints prevent utility firms from supplying energy-intensive facilities, Big Tech will be forced to pause its aggressive deployment schedules. A sudden halt to this $300 billion spending wave would remove a critical prop from US GDP growth, exposing underlying consumer weakness and corporate margin pressures, which would likely drag broader market indices lower.
How do current AI data center investments compare to historical tech spending cycles? Current investments represent a permanent structural shift rather than a temporary cyclical peak, operating at a scale that rivals traditional heavy industry. Projected capital spending by major data center developers is expected to reach $800 billion in 2026, a single-year magnitude that rivals the combined capital expenditures of all non-technology companies within the S&P 500.