
Fed Inflation Tolerance Real Estate: Strategic Shifts
Fed Inflation Tolerance Real Estate: Strategic Shifts for Investors
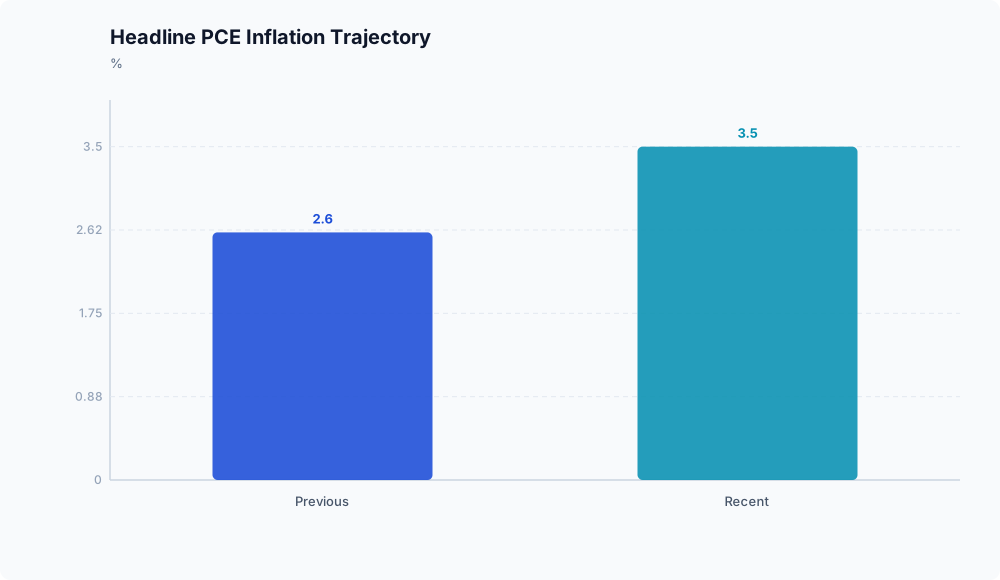
The recent acceleration in macroeconomic data has tested the historical resolve of the US central bank, and its reaction fundamentally alters the strategic landscape for property investors. In recent months, headline Personal Consumption Expenditures (PCE) inflation climbed from 2.6% to 3.5% (Philadelphia Fed), driven largely by external supply shocks rather than domestic economic overheating. Instead of panicking with aggressive monetary tightening, policymakers are adopting a measured “look-through” approach.
This dynamic creates a highly specific environment where Fed inflation tolerance real estate strategies move to the forefront of capital allocation. By treating price increases from tariffs and Middle East geopolitical conflicts as temporary, the central bank is inadvertently engineering a dual benefit for property markets: capping the immediate threat of soaring borrowing costs while allowing elevated inflation to persist as a powerful tailwind for hard asset valuations.
For US market participants, this shift requires an immediate recalibration of risk models. The traditional playbook suggests that rising inflation inevitably triggers rate hikes, which subsequently significantly reduce asset valuations. However, the current policy stance severs that historical correlation. By accepting a slightly elevated inflation baseline to preserve labor market stability, the Federal Reserve is transforming real estate from a rate-sensitive liability into an inflation-hedged beneficiary.
The Transmission Chain: From Supply Shock to Asset Accretion
The current macroeconomic landscape is being shaped by a distinct transmission chain that begins with exogenous supply constraints and ends with asset price inflation. Disruptions in the Middle East and new tariff implementations have fundamentally altered the inflation trajectory, creating a unique challenge that traditional monetary tightening cannot easily resolve.
Picture this policy approach as driving over a bridge during a temporary flood: the Fed recognizes the water is rising due to external supply shocks, but chooses not to slam on the brakes, knowing that monetary policy acts with a 12- to 18-month lag. Philadelphia Fed President Anna Paulson recently confirmed this, noting that current policy is only “mildly restrictive” and aims to keep inflation in check while maintaining labor market stability (Navigating Uncertainty: Inflation, Labor Markets, and the Stance of Monetary Policy).
This measured response sets off a predictable chain reaction across financial markets:
| Phase | Catalyst / Mechanism | Market Impact | Second-Order Effect for Real Estate |
|---|---|---|---|
| 1. Supply Shock | Geopolitical friction and tariffs disrupt supply chains. | Headline PCE inflation rises (reaching 3.5%). | Construction costs rise; new housing starts decline. |
| 2. Fed Response | Central bank “looks through” supply-driven inflation. | Policy remains “mildly restrictive” to protect labor stability. | Avoids a secondary surge in aggressive rate hikes. |
| 3. Rate Stabilization | The absence of aggressive tightening anchors the long end of the curve. | 30-year mortgage rates stabilize near 6.1%-6.3%. | CRE cap rates and mortgage costs find a predictable ceiling. |
| 4. Value Accretion | Inflation persists while borrowing costs plateau. | Real estate supply remains constrained (4.1-month inventory). | Property values rise as an inflation hedge, supporting equity. |
The second-order effect of this transmission chain is perhaps the most lucrative for existing real estate investors: the silent debasement of debt alongside asset price inflation. When inflation runs at 3.5% but borrowing costs remain tethered to a “mildly restrictive” holding pattern, real interest rates effectively decline.
This environment naturally supports higher nominal property valuations and allows landlords to push rent increases to match the broader inflationary current. Furthermore, because supply chain disruptions and tariffs increase the cost of construction materials, the replacement costs for physical properties rise in tandem. This restricts new commercial development and housing starts, inadvertently making existing, stabilized assets more valuable due to artificially constrained inventory.
The Highest-Signal Evidence: Diverging Inflation and Capital Costs
The most critical data points from the recent macroeconomic cycle highlight a chart-friendly numeric contrast: consumer prices are rising, but consumer debt costs are flattening.
While core PCE rose from 2.8% to 3.2% recently (Philadelphia Fed), borrowing costs have not mirrored this upward trajectory. By mid-April, the national average for a 30-year fixed mortgage rate had actually declined to 6.30%, down from 6.83% during the same period in the previous year (Freedom Mortgage). Forecasters anticipate mortgage rates will stabilize between 6.1% and 6.3% through the second quarter.
This divergence indicates that bond markets are pricing in the temporary nature of the Middle East supply disruptions. For fixed-income investors and commercial real estate (CRE) participants, this stabilization is critical because it prevents capitalization rates from blowing out further. A predictable ceiling on borrowing costs allows investors to underwrite acquisitions and refinancings with greater confidence, effectively placing a floor under asset valuations.
Despite this stabilization in borrowing costs, the US housing market remains paralyzed by severe structural supply constraints that continue to drive asset values upward. The primary catalyst for this resilience is a profound lack of inventory, which recently stood at just 1.36 million units. Representing a mere 4.1-month supply, this inventory level remains well below the 5- to 6-month threshold typical of a balanced market (Freedom Mortgage).
This scarcity pushed median home prices to a record high of $408,800, reflecting a market where demand continues to outpace available housing. The Federal Housing Finance Agency reported a 1.6% year-over-year increase in home prices, and Fannie Mae now projects a steeper 3.2% national increase for the year (Freedom Mortgage). For market participants, the implication is clear: real estate is successfully capturing inflation-adjusted price growth because the physical supply of assets cannot expand fast enough.
Forward Scenarios: Navigating the ‘Look-Through’ Era
The Fed’s patience implies that policymakers will not reflexively hike rates, creating a foundation for three distinct forward-looking scenarios based on how these macroeconomic variables interact. Navigating these scenarios requires acknowledging the distinct boundaries between verified economic data and ongoing market uncertainty.
The Base Case: Status Quo and Scarcity In the base case scenario, the Federal Reserve successfully maintains its look-through policy, supporting steady CRE and housing valuations without triggering a broader economic contraction. The labor market remains stable, allowing consumers to absorb higher living costs without triggering widespread mortgage defaults. However, the cost of capital will likely remain a persistent headwind. Forecasters are divided; some expect mortgage rates to remain largely stagnant in the near term due to ongoing geopolitical variables, while competing models suggest gradual declines. Under this scenario, transaction volumes remain muted as buyers and sellers remain locked in a standoff dictated by elevated borrowing costs, but existing asset values hold firm.
The Upside Scenario: Supply Chain Resolution This scenario hinges on a rapid resolution to current supply chain disruptions, which would alleviate the inflationary pressures currently masking underlying economic stability. If the production and shipping bottlenecks from the Middle East clear faster than anticipated, the recent spike in headline PCE could reverse organically. This normalization would give the Federal Reserve the necessary data to justify rate cuts, meaningfully lowering the cost of capital. A subsequent drop in mortgage rates would likely unfreeze the housing market, boosting transaction volumes and providing a much-needed exit liquidity window for CRE developers.
The Downside Scenario: Entrenched Inflation A downside scenario emerges if supply-side inflation bleeds into core services and wages, forcing the Federal Reserve to abandon its look-through posture. If the 3.2% core PCE inflation recorded recently proves sticky, the central bank may be compelled to prioritize price stability over labor market preservation, leading to further rate hikes. Such a tightening cycle would dampen real estate demand, pushing mortgage rates higher and severely stressing highly leveraged CRE assets facing near-term refinancing deadlines. This demand destruction would collide with an already constrained housing market, where a projected 1.4% reduction in housing starts could create severe localized price distortions (Freedom Mortgage).
It is vital to note that current evidence regarding the long-term structural impacts of new tariffs remains thin and highly speculative. It is unclear whether these tariffs will result in a permanent upward shift in the baseline inflation rate or simply cause a temporary price level adjustment. Investors should consequently prioritize assets with durable cash flows and low near-term refinancing needs.
What to Watch Next: Leading Indicators for Capital Allocation

As markets navigate the remainder of the year, capital allocation will be dictated by a specific set of leading indicators. Investors must monitor these metrics to determine if the Fed’s current posture will hold:
- Core PCE Prints: Upcoming core PCE prints will serve as the ultimate litmus test for the Fed’s tolerance. If subsequent monthly releases show inflation broadening beyond supply-constrained sectors, the Fed’s current “mildly restrictive” posturing will likely pivot, forcing a repricing of risk assets.
- Labor Market Stability: Current central bank rhetoric relies heavily on the premise that policy is restrictive enough to cool prices without fracturing employment (Philadelphia Fed). Watch non-farm payroll and wage growth data. A sudden deterioration in labor stability could force the Fed to ease policy, whereas continued labor tightness would erode the justification for looking through elevated PCE prints.
- Housing Starts and Inventory: Investors must track monthly housing start reports. Fannie Mae projects a 1.4% year-over-year reduction in total housing starts for the year (Freedom Mortgage). Continued declines in new development will likely funnel institutional capital toward existing assets, driving up valuations for stabilized portfolios.
- FHFA Home Price Indices: As long as the FHFA indices confirm that nominal prices are holding firm due to scarcity, real estate debt funds and mortgage-backed securities will remain highly attractive to yield-seeking investors.
Conclusion

The data paints a definitive picture of a market in transition. By choosing to absorb the 90-basis-point spike in headline PCE without resorting to punitive rate hikes, policymakers have drawn a line in the sand. This environment dictates that US investors should recalibrate their risk models to prioritize supply-shock inflation over interest rate risk.
Ultimately, Fed inflation tolerance real estate dynamics offer a unique window of opportunity. The combination of stabilized borrowing costs, constrained physical inventory, and elevated nominal inflation effectively insulates existing property owners from broader macroeconomic volatility. Market participants who secure long-term, fixed-rate debt in this environment are well-positioned to benefit as the central bank “looks through” the inflation that slowly erodes their real debt burden, allowing capital appreciation to be driven by undeniable scarcity.
Disclaimer: This analysis is for informational purposes only and does not constitute investment, financial, real estate, or legal advice. Always consult a licensed financial advisor before making investment decisions.
FAQ
How does the Fed’s inflation tolerance affect commercial real estate cap rates? By treating supply-driven inflation as temporary and maintaining a “mildly restrictive” policy rather than aggressively hiking rates, the Fed effectively places a ceiling on benchmark yields. This absence of a hawkish shock anchors borrowing costs, preventing commercial real estate (CRE) capitalization rates from blowing out further and providing a vital floor of stability for property valuations.
Why do supply-shock inflation and tariffs benefit existing property values? Supply chain disruptions and tariffs increase the cost of construction materials, which drives up the replacement costs for physical properties. This dynamic restricts new commercial development and housing starts. As a result, existing, stabilized assets become more valuable due to artificially constrained inventory, allowing them to capture inflation-adjusted price growth.
Will mortgage rates surge again if PCE inflation stays above 3%? Not necessarily, provided the inflation remains driven by temporary supply shocks. Forecasters note a divergence where headline inflation climbed to 3.5%, yet 30-year fixed mortgage rates declined to 6.30%. However, if inflation bleeds into core services and wages, mutating into entrenched demand-driven inflation, the Fed could abandon its “look-through” approach and hike rates, which would push mortgage rates higher.
How does a supply-constrained housing market react to a ‘look-through’ monetary policy? A supply-constrained market reacts with sustained price appreciation. Because the Fed’s policy stabilizes borrowing costs without crushing demand, the severe lack of inventory (currently at a 4.1-month supply) dictates market pricing. With Fannie Mae projecting a 1.4% reduction in housing starts, the existing supply deficit is exacerbated, forcing median home prices higher due to scarcity.