
Fed Rate Cut Pricing and Equity Market Transmission Explained
How Fed rate cut pricing transmits across equity balance sheets
Why do expectations of Federal Reserve interest rate cuts trigger sudden performance divergence between small-cap and large-cap equities?
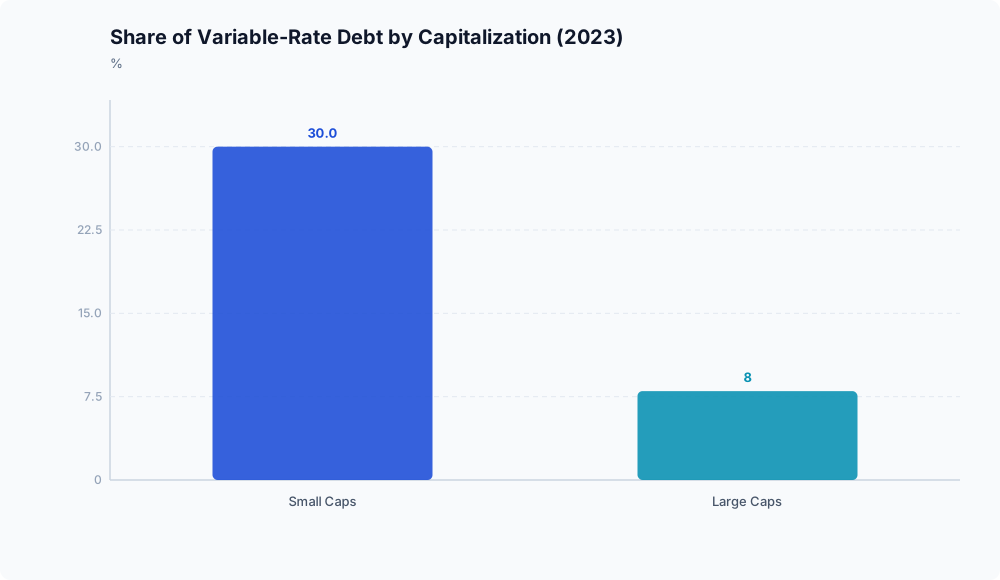
The divergence is driven by capital structure: small-cap companies carry nearly four times the proportion of variable-rate debt compared with large caps. When markets price in Federal Reserve easing, investors anticipate direct, immediate interest expense relief for small firms, while large corporations with fixed-rate liabilities see little immediate change in their debt-servicing costs.
This transmission affects smaller firms unevenly. Lower policy rates provide immediate cash-flow relief on floating liabilities, but they do not resolve structural operating losses or guarantee uniform earnings expansion across financial intermediaries like regional banks.
Capital structure as the transmission mechanism
When expectations shift toward monetary easing, equity markets focus more heavily on corporate debt sensitivity. That reaction reflects differences in how small- and large-capitalization companies finance their operations.
According to Voya data cited by WisdomTree, approximately 30% of small-cap debt in the United States was variable rate in 2023, compared to just 8% for large caps. Because floating-rate liabilities adjust relatively quickly to shifts in benchmark interest rates, an easing cycle offers direct balance-sheet relief to smaller borrowers. In contrast, large-cap companies entered the easing environment largely insulated from near-term borrowing rate adjustments because they had predominantly locked in fixed-term financing.
The July 2024 rotation and benchmark fracture
When expectations for Fed rate cuts solidified in mid-2024, this debt asymmetry fueled a sharp rotation across equity styles. Analysis by WisdomTree recorded a 15-session performance differential of nearly 21 percentage points between the large-cap Russell 1000 Growth and small-cap Russell 2000 Value indexes in late July 2024. Investors favored companies burdened by floating-rate borrowing costs over mega-cap growth firms that had previously leveraged low fixed debt and significant cash reserves.
The rotation interrupted normal index-level co-movement. Data from Fidelity’s Jurrien Timmer cited by WisdomTree showed that the 13-week correlation between the equal-weighted S&P 500 and the cap-weighted S&P 500 fell to 36% during the most acute divergence days in late July 2024, down from its historical baseline of roughly 99%.
While this decoupling reflects market repricing around balance-sheet exposure, the rotation also coincided with quarterly earnings announcements and broader macroeconomic reports. Debt structure was a primary catalyst for the shift, alongside those other factors.
Fundamental limits: solvency and sector cross-currents
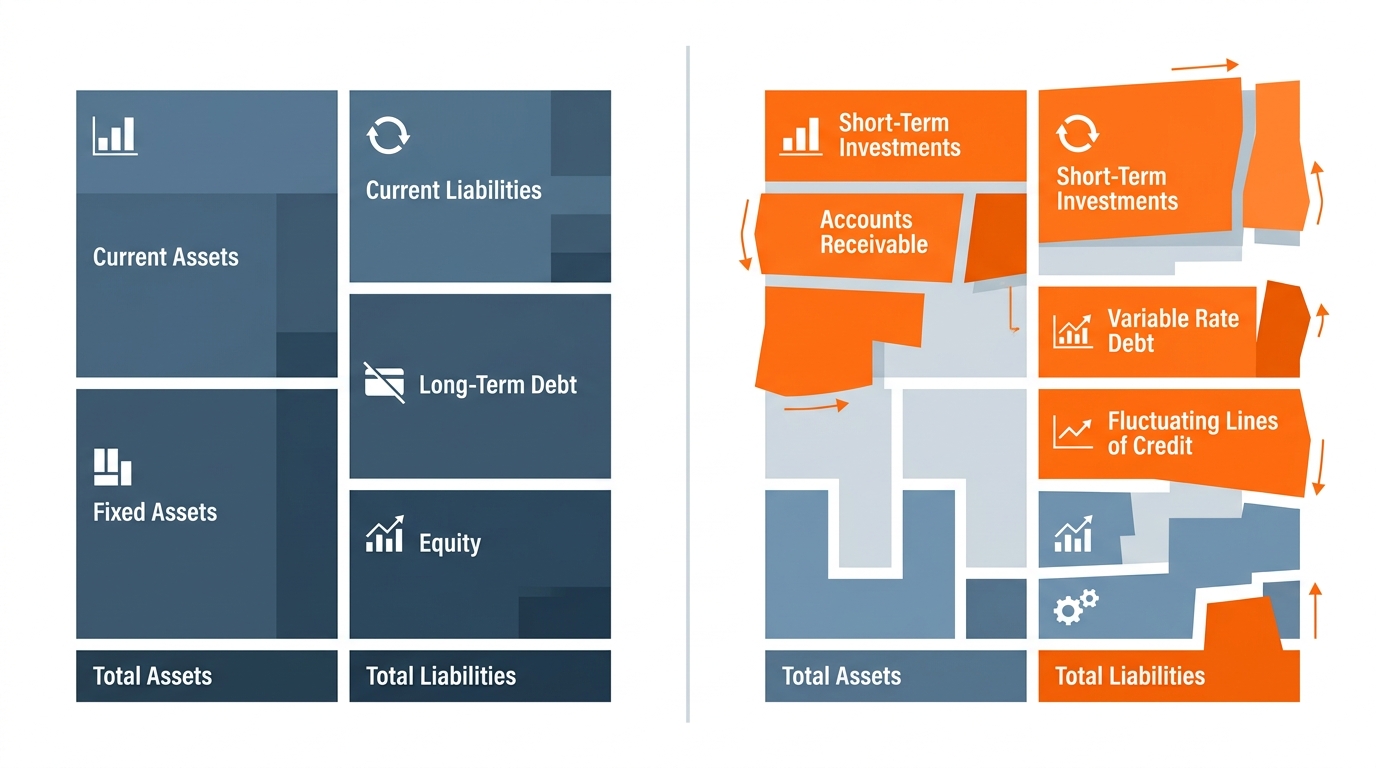
Lower interest expenses improve short-term liquidity without altering underlying business models. Analysis from BingX noted that while the Russell 2000 gained 12.25% year-to-date through late April 2026, over 40% of the companies within the index remained unprofitable. For unprofitable companies, falling policy rates extend operating runways by reducing debt carrying costs, but operating margins remain negative.
Transmission also diverges within the small-cap segment itself. According to BingX, Financials and Industrials represent over 40% of the Russell 2000’s value-oriented segment. For financial intermediaries, falling rates present competing pressures:
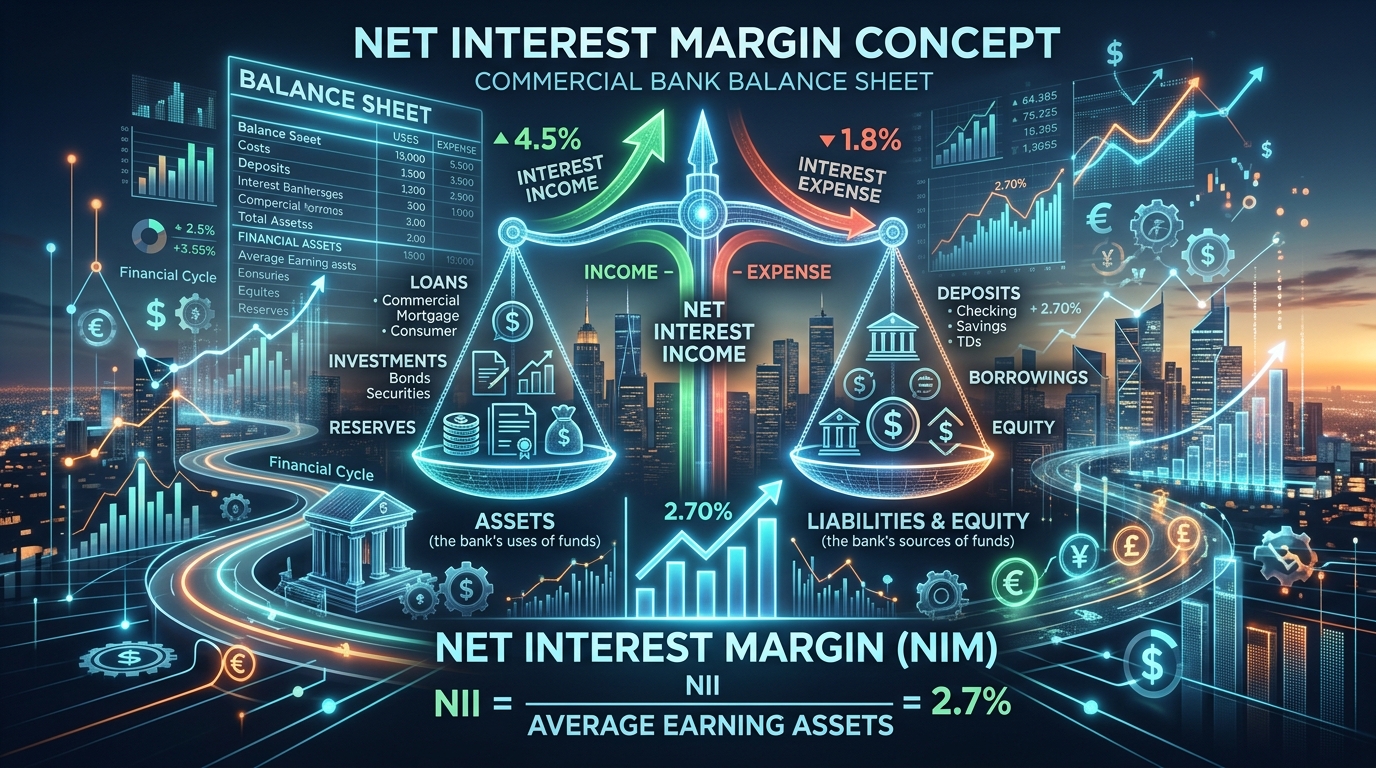
- When short-term policy rates fall, yields on floating-rate loans reprice downward quickly, putting downward pressure on net interest margins (NIMs) if deposit costs adjust more slowly. Available market data does not quantify the precise net NIM contraction during this period, leaving the exact earnings headwind for regional lenders conditional on individual balance sheets.
- Lower policy rates reduce yields on alternative short-term instruments like money-market funds, according to source commentary from WisdomTree. This dynamic relieves regional banks from having to offer peak deposit rates near 5% to combat liquidity outflows.
Analytical synthesis
Rate cut pricing affects equities unevenly. In the short term, investors favor small caps carrying high floating debt because lower benchmark rates offer immediate expense relief, while large caps with fixed debt remain mostly insulated.
Sustaining this rotation over time depends on more than debt structure. Debt-heavy industrial and service companies benefit directly from lower financing costs, but the broader small-cap index includes a high share of unprofitable businesses, and regional banks face conflicting pressures on their loan yields and deposit costs.
Disclaimer: This analysis is for informational purposes only and does not constitute investment, financial, real estate, or legal advice. Always consult a licensed financial advisor before making investment decisions.