
FOMC SEP Rate Path Repricing: Parsing Fed Projections
Federal Reserve policy trajectory: parsing the evidence behind rate path expectations
What the Fed’s late-2026 policy record confirms
Heading into late 2026, market participants face shifting expectations around central bank policy. The record confirms that the Federal Reserve established a baseline rate midpoint of 3.625% in June 2026, followed by internal hawkish dissent in July. In the September 2026 projections, FOMC participants raised their median projected federal funds rate to 4.1% for both 2026 and 2027. While central bank documentation outlines this higher median path, it reflects individual assessments of appropriate monetary policy rather than a binding policy commitment, and the release provides no empirical proof of widespread credit distress. Evaluating interest rate risk across asset classes requires separating established policy votes and official economic projections from theoretical market mechanics.
Mid-2026 policy baseline and committee dissent
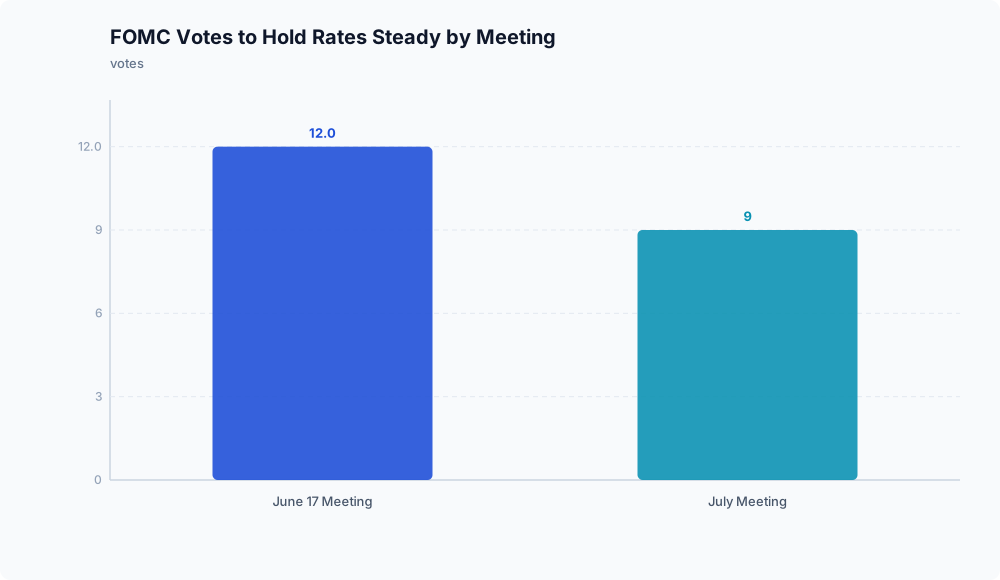
The Federal Reserve established its late-summer policy stance at the June 17, 2026 meeting. According to Wall Street Economicists, the Federal Open Market Committee (FOMC) voted 12-0 to maintain the federal funds target range at 3.50% to 3.75%. This established a benchmark midpoint of 3.625% Wall Street Economicists, which serves as the reference level for subsequent decisions.
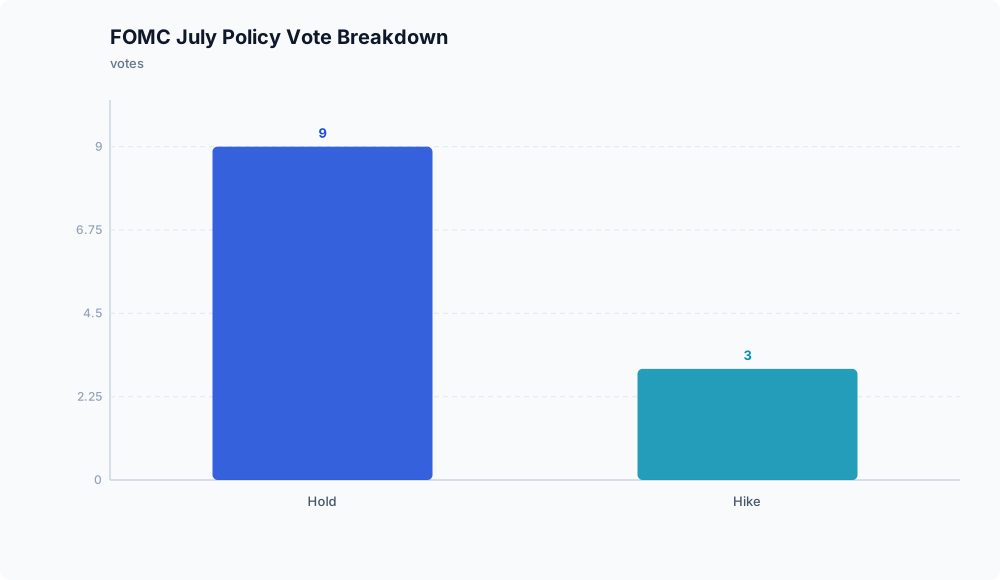
Internal debate over policy restrictiveness emerged shortly after. As reported by Investing.com, the FOMC’s July policy decision shifted to a contested 9 to 3 vote to hold rates steady, with three dissenting members voting for an immediate rate increase. This vote reflected growing hawkish pressure within the Committee ahead of the autumn economic projections.
September projections and the 4.1% projection
Policymakers updated their expectations during the September 15-16, 2026 FOMC meeting. The Federal Reserve’s Summary of Economic Projections shows that 18 participants submitted economic and policy assessments. One official did not submit rate or macroeconomic projections for 2028 and 2029, leaving all 18 focused on the nearer-term policy horizon.
In the Summary of Economic Projections, the FOMC participants published a median projected federal funds rate of 4.1% for year-end 2026 and 4.1% for 2027, an upward revision from the 3.8% and 3.6% projected in June. For 2026, the central tendency for the policy rate spanned 4.1% to 4.4%, with a total participant range of 3.9% to 4.4% [PDF] Summary of Economic Projections, September 16, 2026. Compared to the 3.625% baseline midpoint reported by Wall Street Economicists, these official figures outline an anticipated upward repricing of the policy path, though the estimates reflect individual participant judgments rather than a formal policy pledge.
Financial mechanics and empirical market impact

Maintaining rates near the 3.625% midpoint Wall Street Economicists or along the projected 4.1% path [PDF] Summary of Economic Projections, September 16, 2026 affects equity valuations and corporate credit through standard transmission mechanisms:
- Discounted cash flows: Growth equities carry long duration because their intrinsic value relies on cash flows projected far into the future. In discounted cash flow models, future earnings are discounted by $(1 + r)^t$. When the baseline rate remains elevated, the higher discount rate $r$ compounding across horizon $t$ mechanically reduces the present value of those distant cash flows, lowering valuation multiples.
- Credit channel pressure: Smaller enterprises typically rely on higher proportions of floating-rate bank debt or short-term maturities than large-cap firms. Higher baseline borrowing costs increase periodic interest expenses, reduce interest coverage ratios, and raise refinancing hurdles when debt facilities mature.
- Balance sheet differences: Cash-rich mega-cap firms can benefit by earning higher yields on short-term liquid reserves without facing immediate refinancing pressures, while banks can manage duration to protect net interest margins.
These mechanisms describe theoretical relationships rather than observed outcomes. The documentation in the Federal Reserve Summary of Economic Projections does not track aggregate small-cap default rates, firm-level balance sheet data, bank risk profiles, or equity sector returns. While higher rates exert mathematical pressure on valuations and debt service, the actual extent of multiple compression and corporate distress remains an empirical question.
Distinguishing policy decisions from projections

Assessing interest rate risk requires separating documented policy votes from economic projections. The record confirms a 3.625% baseline Wall Street Economicists that drew three dissents favoring higher rates in July Investing.com. While the FOMC published an official median projected rate of 4.1% for 2026 and 2027 [PDF] Summary of Economic Projections, September 16, 2026, these submissions reflect individual policymaker views of appropriate policy rather than an unconditional policy commitment, and the Fed record does not document widespread damage across corporate credit. Higher borrowing costs exert clear mechanical pressure on long-duration assets and floating-rate debt, but the broader effects on corporate performance depend on incoming credit and financial data.
Disclaimer: This analysis is for informational purposes only and does not constitute investment, financial, real estate, or legal advice. Always consult a licensed financial advisor before making investment decisions.