Why the 30-Year Mortgage Rate 7 Percent Mark Divides Housing
Why mortgage rates are pushing 7% again, and how it divides the housing market
Why have 30-year mortgage rates returned to near 7% instead of falling as projected?
Mortgage rates climbed back toward 7% after benchmark 10-year U.S. Treasury yields surged toward 4.8% by early September 2026, according to List with Tina. The bond market sell-off followed steady job growth and persistent inflation readings, which prompted investors to scale back expectations for Federal Reserve interest rate cuts. Because mortgage originators price residential loans at a spread above the 10-year Treasury yield, the benchmark’s rise swiftly unraveled earlier forecasts projecting financing costs to average roughly 6.3%, as reported by List with Tina.
This rate pressure has split the housing market: individual homeowners in the resale sector remain locked in place, while well-capitalized production builders are taking smaller profit margins to buy down mortgage rates and keep inventory moving.
Benchmark yields overturn midyear easing forecasts
Residential mortgage pricing links directly to sovereign debt yields. Originators set 30-year fixed-rate mortgages by adding a spread covering credit, servicing, and prepayment risk over the benchmark 10-year U.S. Treasury yield. When Treasury yields move, primary lending rates follow.
Earlier expectations pointed toward steady mortgage relief. According to List with Tina, Realtor.com’s midyear 2026 forecast projected that 30-year fixed rates would average roughly 6.3% throughout 2026 and finish the year near that mark.
Instead, benchmark yields moved higher. As the 10-year Treasury yield approached 4.8% by early September 2026, Freddie Mac’s average 30-year fixed mortgage rate climbed to 6.71%, with daily lender survey quotes pushing between 6.8% and 7.0%, according to List with Tina.
This upward shift stems from persistent macroeconomic strength that limits the Federal Reserve’s room to loosen monetary policy. Economic figures cited by List with Tina show:
- The U.S. economy added 162,000 jobs in August 2026.
- The unemployment rate held steady at 4.1%.
- Headline Consumer Price Index (CPI) inflation registered at 3.4% year-over-year for July 2026.
Because mortgage-backed securities compete against government debt for investor capital, higher sovereign yields directly lift mortgage rates.
The lock-in freeze in existing homes
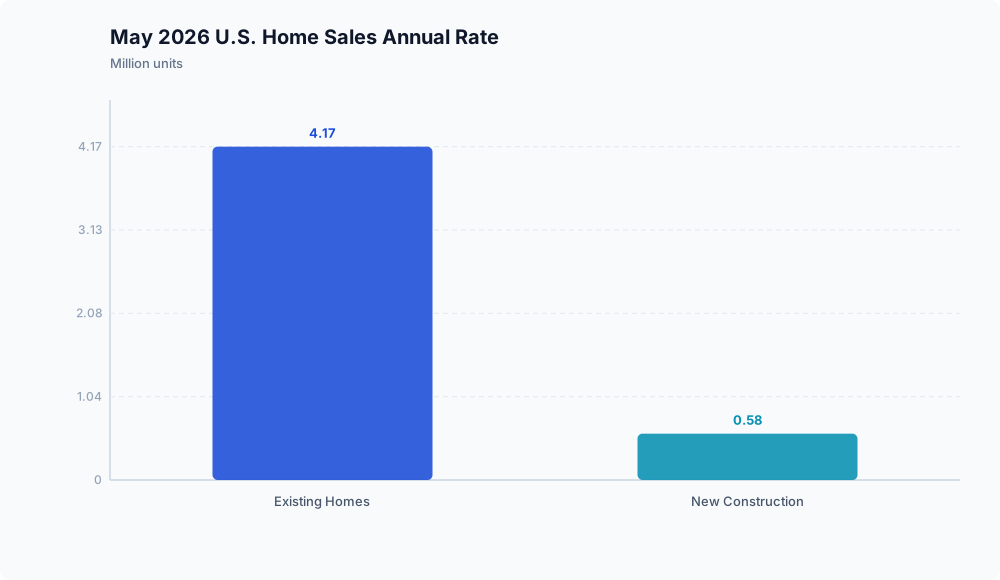
The return to borrowing costs near 7% reinforces a divide in transaction volumes. Resale activity accounts for most home sales, but the market remains constrained by the rate lock-in effect.
According to data published by the CFA Institute Enterprising Investor, U.S. existing home sales ran at a seasonally adjusted annual rate (SAAR) of 4.17 million units in May 2026, compared to 580,000 units for new construction.
Even though existing home sales outnumber new construction by more than seven to one, resale liquidity remains tight. Homeowners who financed properties at lower historical rates face higher borrowing costs if they sell and take out a new mortgage today. Individual sellers cannot offer financing subsidies the way large companies do, so their only direct way to attract buyers is cutting the contract price, which reduces their equity. As a result, many prospective sellers stay in place.
How production builders clear inventory
Unlike individual resale sellers, large production homebuilders adapt to higher rates by using their balance sheets to subsidize borrowing costs for buyers.
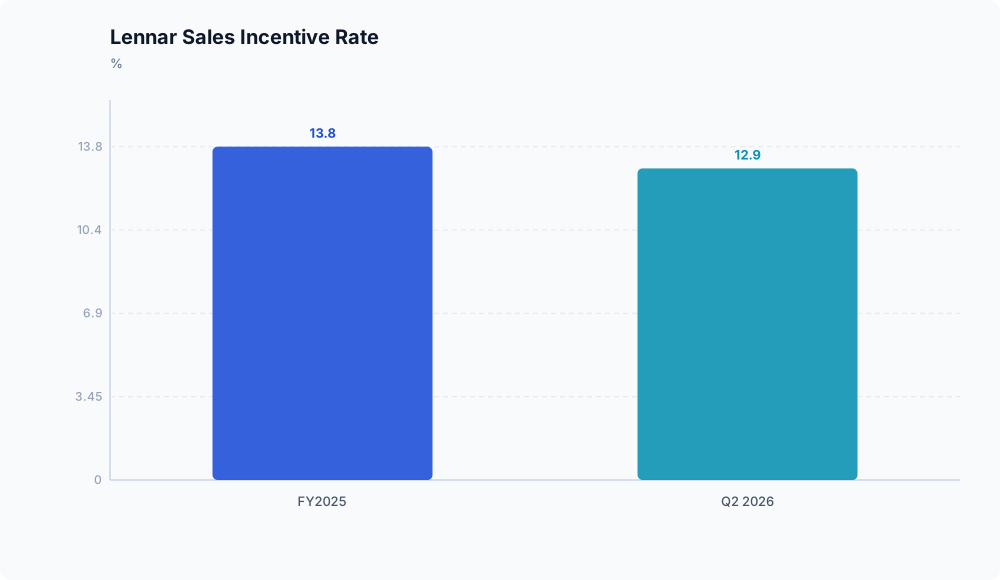
Builder financial disclosures indicate that keeping delivery volumes steady has required smaller profit margins. Figures reported by the CFA Institute Enterprising Investor show the scale of these concessions at Lennar Corporation:
- In FY2025, incentives averaged $62,700 per home, representing 13.8% of home sales revenue, up from 8.8% in FY2023.
- In Q2 2026, Lennar reported a net average selling price of $371,000 alongside an incentive rate of 12.9% on gross contract value.
- This incentive structure implied a gross contract price near $426,000 per home, reflecting a concession wedge of roughly $55,000 per transaction.
Because builders account for these incentives, primarily rate buydowns and closing-cost credits, as direct reductions in sales revenue, they take an ongoing margin hit to keep absorption rates steady.
Lennar Concession Trends (Source: CFA Institute Enterprising Investor)
┌──────────┬──────────────────────────┬─────────────────────────────┐
│ Period   │ Concession Intensity     │ Context                     │
├──────────┼──────────────────────────┼─────────────────────────────┤
│ FY2023   │ 8.8% of sales revenue    │ Initial rate-shock response │
│ FY2025   │ 13.8% of sales revenue   │ Average $62,700 per home    │
│ Q2 2026  │ 12.9% gross contract val │ Implied ~$55k gross-to-net  │
└──────────┴──────────────────────────┴─────────────────────────────┘
Analytical takeaway: a structural real estate split
Instead of an outright collapse in nominal prices, the housing market has divided along structural lines:
- Everyday buyers face market rates near 7% without institutional subsidies, while current owners hold low-rate mortgages. That dynamic holds down listing volume and transaction velocity across the 4.17 million SAAR resale pool reported by the CFA Institute Enterprising Investor.
- Large builders use balance-sheet flexibility to absorb $50,000+ per-home financing wedges, funding below-market rate buydowns to sustain sales and capture market share, according to findings from the CFA Institute Enterprising Investor.
Unless benchmark Treasury yields drop or baseline construction costs decline, production builders will likely continue accepting margin compression to move inventory, while the broader resale market remains in stasis.
Disclaimer: This analysis is for informational purposes only and does not constitute investment, financial, real estate, or legal advice. Always consult a licensed financial advisor before making investment decisions.
Frequently asked questions

Why do 30-year fixed mortgage rates track the 10-year Treasury yield instead of the Federal Funds Rate?
While the Federal Reserve directly sets the short-term overnight policy rate, long-term residential mortgages are priced over longer-dated market benchmarks. Mortgage-backed securities compete directly with instruments like the benchmark 10-year U.S. Treasury note for investor capital, causing long-term mortgage rates to follow shifts in Treasury yields along with an added risk spread.
What is the difference between a permanent mortgage rate buydown and a temporary concession for home buyers?
A permanent rate buydown lowers the underlying note rate for the entire life of the mortgage, which allows a buyer to qualify under lender debt-to-income limits. A temporary buydown or concession provides reduced payments or closing assistance only for an initial period before resetting to the standard market note rate.