
The 10-Year Treasury Yield 5% Level and Stock Valuations
The 10-Year Treasury yield at 5%: valuation pressures and the inverted risk premium
What happens to equity valuations and broader asset allocation when the 10-year Treasury yield crosses 5%?
When the 10-year Treasury yield crosses 5%, it resets hurdle rates across capital markets. By offering a risk-free nominal return higher than the earnings yield of equities, a 5% benchmark inverts the equity risk premium (ERP), compresses valuations on high-multiple growth stocks through higher discount rates, and leaves investors reliant on corporate earnings growth to drive returns.
Macroeconomic foundations: growth without easing
Upward pressure along the sovereign curve developed during the first half of 2026. According to the Monetary Policy Report, July 2026, the Federal Open Market Committee (FOMC) held the target range for the federal funds rate at 3-1/2 to 3-3/4 percent from January through June.
Economic indicators showed steady growth alongside this restrictive stance:
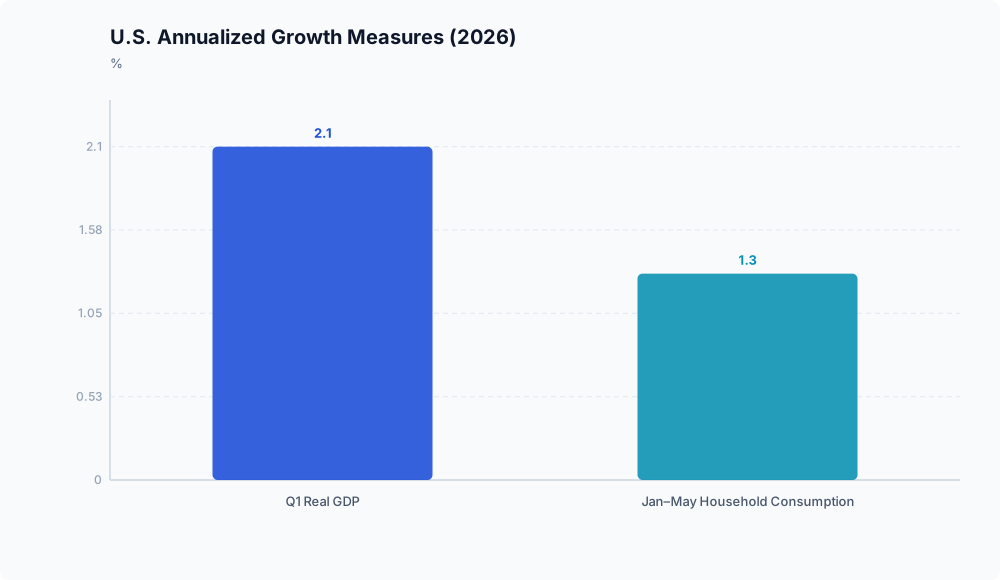
- Real GDP grew at an annualized rate of 2.1 percent in the first quarter of 2026, as documented in the Monetary Policy Report, July 2026.
- Unemployment remained low at 4.2 percent in June (Monetary Policy Report, July 2026).
- Household consumption grew at an average annualized pace of 1.3 percent through the first five months of the year (Monetary Policy Report, July 2026).
Modest personal consumption pointed to sustained household spending without evidence of a recession. With no indication of cyclical deterioration, financial markets had little reason to price in rate cuts, and longer-dated yields adjusted higher as investors priced in steady growth and prolonged monetary restraint.
The September 2026 catalyst
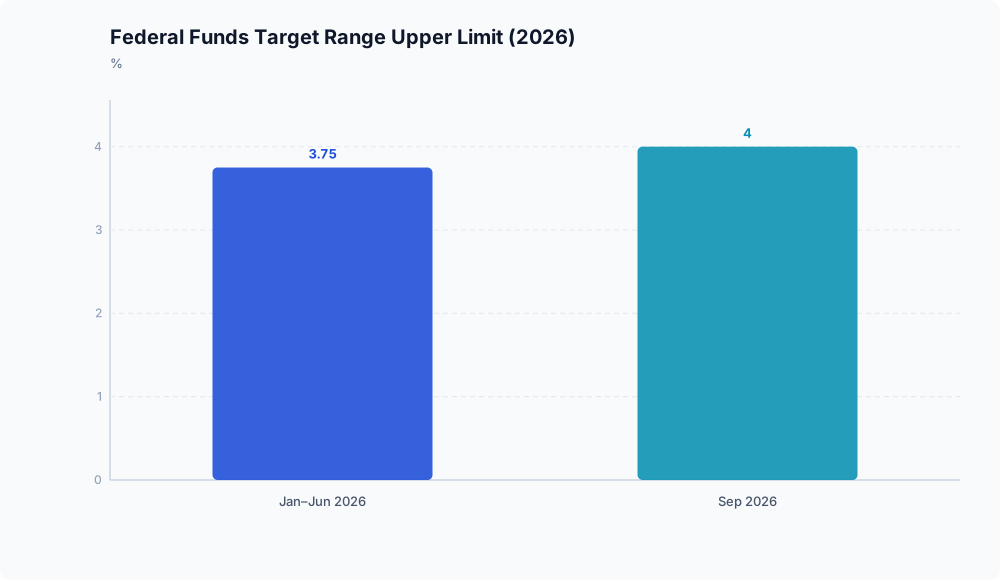
Yields moved higher late in the summer. At its September 2026 meeting, the FOMC raised its target range by 25 basis points to 3.75% to 4.0%, according to Enterprise Bank & Trust.
This policy change prompted an immediate repricing across asset classes:
- The 10-year Treasury yield closed slightly above 5% for two consecutive trading days (Enterprise Bank & Trust).
- The S&P 500 dropped 45 basis points on the announcement day (Enterprise Bank & Trust).
Mechanical pressures and the inverted risk premium
Yields moving past 5% shifted the relative valuation between fixed income and equities. Data from GuruFocus recorded the S&P 500 earnings yield at 3.804% in September 2026.
With the 10-year Treasury yield closing slightly above 5% (Enterprise Bank & Trust), the spread inverted: investors accepted lower earnings yields on corporate equities than guaranteed returns on risk-free sovereign debt.
This dynamic places direct pressure on equity performance through two main mechanisms:
- Discount rate compression: Restrictive monetary policy elevates discount rates on future cash flows to stockholders, creating valuation headwinds (Morningstar).
- Historical performance hurdles: Academic research cited by Morningstar shows that the spread between the S&P 500 earnings yield and real yields explains roughly half of the ex-ante variation in subsequent 10-year stock market returns. Furthermore, during periods when restrictive policy raises discount rates to curb inflation, equities systematically lag earnings-yield baseline expectations over near-term, one-year horizons.
The earnings outlook for asset allocators

Central bank easing appears distant. Federal Reserve guidance reported by Enterprise Bank & Trust projects:
- One additional policy rate hike before year-end 2026.
- No rate changes throughout 2027.
- Rate reductions resuming only in 2028, with inflation not expected to reach target levels until 2029.
Under this timeline, equity portfolios cannot rely on lower discount rates or multiple expansion. Although full-year 2026 S&P 500 earnings are projected to expand by more than 30% (Enterprise Bank & Trust), corporate earnings must match these high expectations to support current valuation premiums over guaranteed sovereign yields.
Disclaimer: This analysis is for informational purposes only and does not constitute investment, financial, real estate, or legal advice. Always consult a licensed financial advisor before making investment decisions.
Frequently asked questions

Does a bear steepening above 5% signal an imminent economic contraction? No. Macroeconomic evidence from the Monetary Policy Report, July 2026 indicates the rise in longer-dated yields stemmed from economic resilience, including 2.1% GDP growth and a 4.2% unemployment rate, which removed the justification for central bank rate cuts.
Which equity sectors face the highest sensitivity to a sustained 5% cost-of-capital floor? Growth sectors face heightened valuation sensitivity as restrictive monetary conditions elevate discount rates on future cash flows (Morningstar). In addition, higher interest rates threaten broader corporate earnings growth, while potential government regulation introduces specific downside risks for artificial intelligence firms (Enterprise Bank & Trust).