
The CRE Refinancing Wall and Cap Rate Repricing Outlook
The CRE refinancing wall and the end of rate-cut relief
Commercial real estate borrowers cannot count on near-term monetary easing to resolve upcoming loan maturities. Federal Reserve projections indicate that policy rates will remain elevated through 2027, exhausting the relief gained through short-term loan extensions. Maturing mortgages face higher borrowing costs that reduce loan sizing under standard underwriting criteria, leaving property owners to inject fresh equity, secure structured recapitalizations, or enter formal lender workouts.
Higher policy rates close the window for near-term relief
In September 2026, the Federal Open Market Committee (FOMC) unanimously raised the federal funds target range by 25 basis points to 3.75% to 4.00%, as reported by J.P. Morgan Asset Management. Along with the rate increase, the Committee released an updated Summary of Economic Projections (SEP) that pushed back expectations for monetary easing.
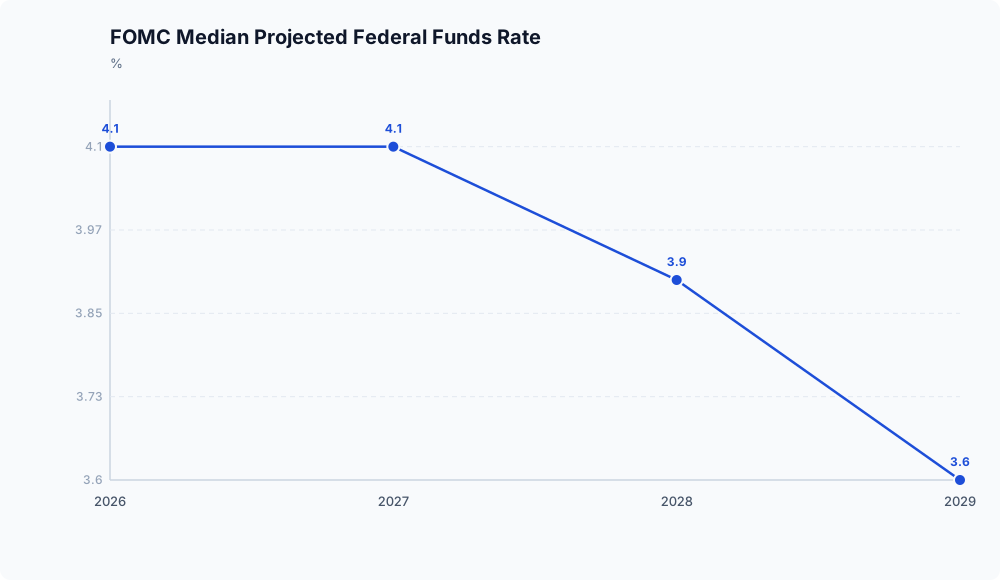
According to the September 2026 SEP detailed by J.P. Morgan Asset Management, the median FOMC participant projected the federal funds rate to reach 4.1% by year-end 2026 and remain flat at 4.1% through 2027. Rate cuts are not projected to begin until 2028 (to 3.9%) and 2029 (to 3.6%). These projections reflect eighteen participants, as Federal Reserve Chair Warsh did not submit economic projections or a dot plot for the second consecutive SEP release.
This rate path undercuts the premise of recent “extend-and-pretend” arrangements. Sponsors who negotiated short-term extensions or relied on floating-rate bridge loans expected benchmark rate cuts to restore their debt service coverage ratios (DSCR) within one or two years. With borrowing costs projected to remain restrictive through at least 2027, those maturing loans must be refinanced at prevailing market rates.
The underwriting math: why proceeds contract
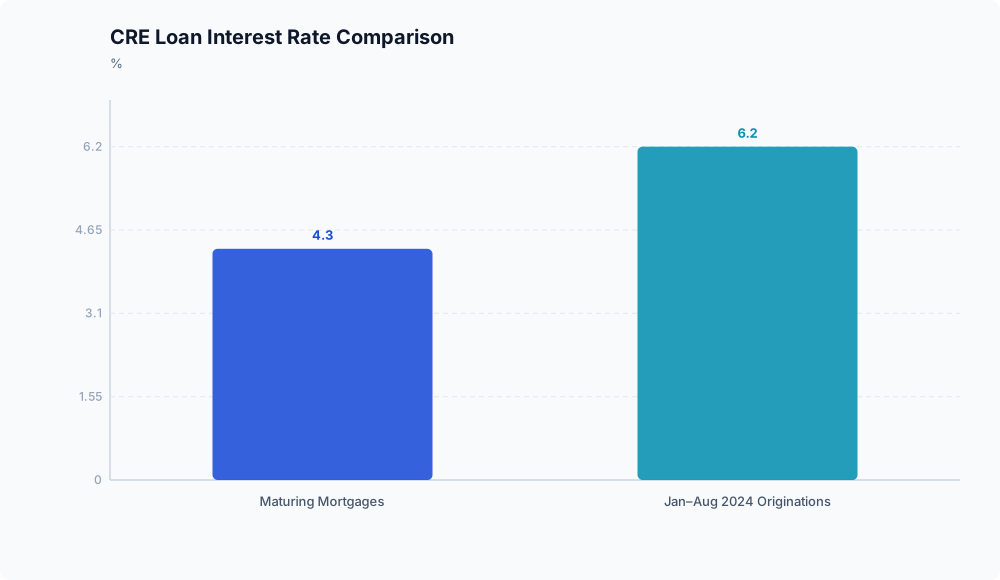
The refinancing gap stems from the difference between legacy borrowing costs and prevailing coupon rates. According to an S&P Global analysis cited by JD Supra, the average interest rate on U.S. CRE loans originated between January and August 2024 was 6.2%, compared to 4.3% on the maturing mortgages evaluated in the study.
Debt modeling published by Apers demonstrates the direct effect of this difference: an interest rate increase of 200 to 300 basis points compresses new loan proceeds by 25% to 35% when net operating income (NOI) and DSCR requirements remain unchanged.
Because lenders size principal against property cash flow, higher borrowing costs increase the annual debt service required per dollar borrowed. Unless property NOI has grown enough to compensate for that higher debt constant, the maximum loan an asset can support falls below the maturing loan balance. Borrowers must fund the resulting shortfall to pay off the maturing debt at par.
Sizing the maturity wave
This reduction in loan proceeds coincides with a large volume of maturing commercial mortgages, though market forecasts differ on the exact timing and scale.
Approximately $950 billion in U.S. CRE mortgages matured in 2024, as reported by JD Supra. For subsequent years, Apollo Academy’s Torsten Slok outlined a steep three-year maturity wall in a February 2025 note cited by Apers. MMG Real Estate Advisors estimated that $1.5 trillion or more would mature through 2026 alone, while Kidder Mathews tracked $1.26 trillion in CRE debt maturing cumulatively through 2027 (Apers). S&P Global Market Intelligence projected that maturities would peak in 2027 alone at approximately $1.26 trillion (JD Supra).
While these projections vary on whether the heaviest volume arrives early or concentrates in 2027, each confirms that several trillion dollars in debt must roll over in an elevated interest rate climate.
Underwriting pressure from these maturities is already evident in weaker asset classes. According to Apers, Trepp reported that office commercial mortgage-backed securities (CMBS) delinquency reached the 10% to 12% range by the first quarter of 2026, showing the strain when softening property fundamentals intersect with lower loan proceeds.
Strategic paths for maturing debt
Because new loan proceeds often fail to retire existing principal in full, borrowers and lenders face a limited set of options:
- Sponsor equity injections, in which property owners provide new junior capital or cash-in payments to reduce the loan balance to what current debt service can support.
- Bridge recapitalizations, bringing in structured mezzanine debt or preferred equity to fill the proceeds shortfall, usually at higher rates.
- Lender workouts and discounted payoffs (DPOs), negotiating modified loan terms, extending amortizations, or accepting a discounted settlement on the principal.
- Distressed dispositions, moving properties into foreclosure, deeds-in-lieu, or distressed sales when owners cannot or choose not to commit further equity.
While market data shows why loan proceeds must contract, available evidence does not establish what proportion of maturing CRE loans will refinance at par versus the share that will require sponsor equity cures, loan restructurings, or liquidation.
Disclaimer: This analysis is for informational purposes only and does not constitute investment, financial, real estate, or legal advice. Always consult a licensed financial advisor before making investment decisions.
Frequently asked questions

Why does a 200 to 300 basis point rate increase reduce refinancing proceeds if property NOI is stable?
New loan proceeds are constrained by the debt-service coverage ratio (DSCR). An interest rate increase of 200 to 300 basis points increases the annual debt service per dollar borrowed. With net operating income (NOI) held constant, less total principal can be supported while meeting the lender’s minimum DSCR threshold, leading to a 25% to 35% reduction in new loan proceeds according to modeling by Apers.

When does the FOMC project monetary easing to resume according to the revised Summary of Economic Projections?
According to the September 2026 Summary of Economic Projections cited by J.P. Morgan Asset Management, the median FOMC participant expects the policy rate to remain flat at 4.1% through 2027, with rate cuts only projected to begin in 2028 (declining to 3.9%) and 2029 (to 3.6%).