
Energy-Driven Inflation Divergence: Sentiment and Equities
Energy-Driven Inflation Divergence: Assessing Sentiment, Policy Risks, and Market Concentration
How Is Energy Price Pressure Affecting the Economy and Equity Markets?
Energy cost pressures are visibly depressing US household sentiment, but their broader macroeconomic and corporate impacts are obscured by unverified inflation data and masked by extreme equity market concentration.
While rising fuel and goods costs have directly driven consumer confidence to multi-year lows, documented evidence does not confirm specific statistical divergences between headline and core inflation, nor does it reveal the Federal Reserve’s internal stance. Furthermore, apparent stock market resilience does not reflect broad corporate health; rather, index-level stability is overwhelmingly anchored in a narrow cluster of semiconductor and technology firms.
Household Sentiment Bears the Immediate Energy Burden
The clearest confirmed transmission channel for energy price pressures is domestic consumer sentiment. In September 2026, US consumer confidence dropped to its lowest level since 2014 ahead of the midterm elections, with rising retail goods and fuel costs cited as primary drivers of the downturn, according to reporting by Al Jazeera.
Non-discretionary expenses such as fuel and basic goods rapidly diminish disposable income. When retail gasoline and everyday commodity prices climb, household expectations deteriorate quickly, dampening discretionary demand across the broader economy.
However, the downstream effect on corporate profitability is less clear. In theory, high fuel inputs squeeze cyclical companies through increased transportation and logistics costs, compounded by weakening consumer purchases. Yet because corporate earnings results and specific margin reports across cyclical industries are absent from the documented record, the exact degree of corporate margin compression remains an analytical inference rather than an observed fact.
The Inflation Data Gap and Federal Reserve Uncertainty
Market commentary frequently attributes central bank dilemmas to an energy-driven divergence between headline and core Consumer Price Index (CPI) metrics. However, verified data confirming specific statistical divergences between core and headline metrics or specific energy price inflation rates does not exist in the recorded evidence. Consequently, claims of an empirical wedge between core and headline metrics cannot be validated.
Similarly, available economic data does not record the Federal Reserve’s internal deliberations or formal policy shifts regarding this dynamic. While it is plausible that policymakers face a trade-off between tightening against headline commodity price increases and easing to cushion softening consumer demand, this scenario remains a conditional hypothesis. Without confirmed inflation readings or documented central bank communications, any direct causal link between inflation divergence and impending monetary policy decisions remains unproven.
Market Valuation Masks Narrow Fundamental Strength

Persistent monetary tightness typically raises discount rates and compresses valuation multiples across capital-intensive sectors. Yet broad-market multiple compression has not been uniformly documented across non-technology industries. Instead, overall market health is largely shielded by historically high concentration within the equity benchmarks.
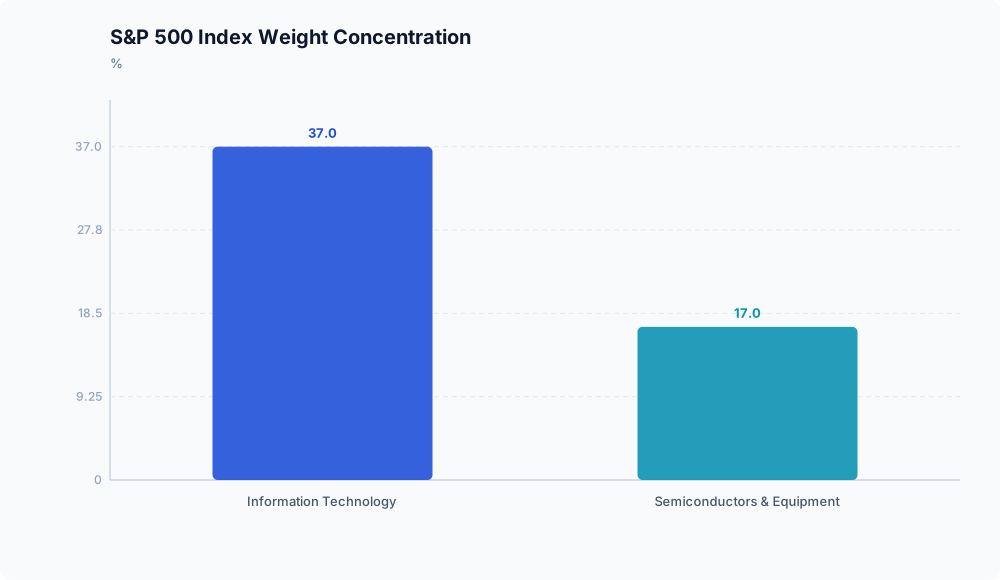
As of September 2026, the information technology sector represented roughly 37% of the total S&P 500 index weight Nida Financial Group. Aggregate valuation metrics are therefore heavily influenced by this single sector, rather than reflecting widespread strength across the median stock.
S&P 500 Index Weight Distribution (September 2026)
┌────────────────────────────────────────────────────────┐
│ Rest of S&P 500: ~63%                                  │
├──────────────────────────────────┬─────────────────────┤
│ Other Information Technology:    │ Semiconductors &    │
│ ~20%                             │ Equipment: ~17%     │
└──────────────────────────────────┴─────────────────────┘
Source: [Nida Financial Group](https://nidafinancialgroup.com/weekly-market-commentary-whats-holding-up-record-sp-500-margins-september-21-2026)
This structural concentration is even narrower within technology itself. As of September 2026, the semiconductor and semiconductor equipment industry group accounted for approximately 45% of the information technology sector and roughly 17% of the entire S&P 500 Nida Financial Group.
Because headline market margins and index valuations are heavily tied to semiconductor heavyweights, the broader equity market is exposed to asymmetric risk. If prolonged monetary pressure or consumer demand pullbacks eventually weigh on semiconductor spending, the broader index lacks the margin buffers elsewhere to prevent multiple compression.
What the Evidence Means

The economic landscape in late 2026 reflects a distinct divergence between public sentiment and headline financial stability:
- Consumer vulnerability is measurable: Higher fuel and everyday costs have directly eroded consumer confidence to a twelve-year low Al Jazeera, establishing that households are absorbing real financial pressure.
- Policy predictions remain speculative: Without verified CPI prints or official central bank records, positioning for specific Federal Reserve actions remains an unconfirmed strategy.
- Index stability is fragile: Headline equity resilience is not an indicator of broad corporate endurance, but a byproduct of outsized index weighting in hardware and semiconductor manufacturers Nida Financial Group.
Disclaimer: This analysis is for informational purposes only and does not constitute investment, financial, real estate, or legal advice. Always consult a licensed financial advisor before making investment decisions.