
Shelter Disinflation and Multifamily Valuations: Key Risks
Shelter disinflation and multifamily valuations: what slower rent growth means for operating margins and debt
How deceleration in U.S. rent inflation below pre-pandemic norms affects multifamily operations, debt coverage, and asset valuations
According to the U.S. Department of the Treasury, U.S. rent of housing inflation slowed to 3.0% over the twelve months through March 2026. This deceleration below the pre-pandemic average benchmark of 3.3% signals that property owners have lost the outsized top-line pricing power enjoyed during the pandemic era. For operators and investors, this moderation narrows the revenue buffer needed to outpace operating expenses, tightens debt service coverage ratios (DSCR), and puts upward pressure on capitalization rates.
The reset in top-line rental growth
Over the twelve months through March 2026, U.S. rent of housing inflation cooled to 3.0%, marking its slowest pace since September 2021 and dropping below the pre-pandemic baseline of 3.3%, as reported by the U.S. Department of the Treasury.
Falling below pre-pandemic norms represents a normalization in revenue growth. Landlords can no longer command automatic, outsized rent increases during lease turnovers or renewals.
Because the Treasury’s macro-level data is confined to the aggregate headline figure, specific underlying drivers, such as localized multifamily supply deliveries, market-specific vacancy spikes, or tenant affordability constraints, cannot be quantified from the release alone. The headline figure confirms that top-line revenue expansion has reset below historical averages, but the exact operational impact across specific regional portfolios requires asset-level examination.
Net operating income and expense compression risks
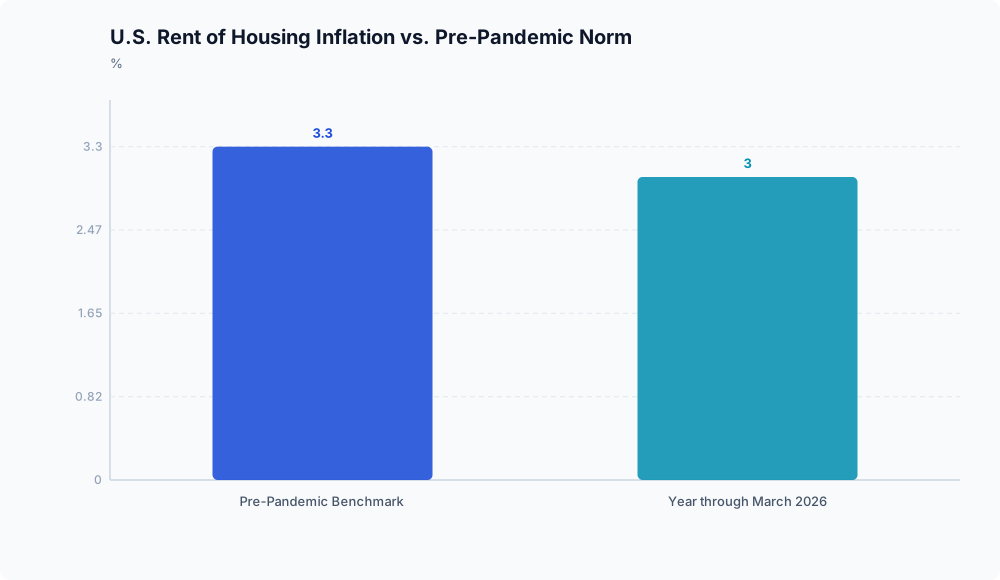
In real estate accounting, gross rental receipts are the primary foundation for gross operating income. When top-line rent growth slows to 3.0%, it significantly narrows the financial cushion property managers rely upon to absorb operating cost increases.
Net operating income (NOI) depends on the spread between top-line revenue growth and operating expenses. If semi-variable and fixed property-level expenses, including municipal real estate taxes, property insurance premiums, and ongoing maintenance, escalate at an annual rate above 3.0%, operational profit margins face mathematical compression. In that scenario, overhead costs consume a larger share of gross revenue, putting direct downward pressure on asset-level profitability.
However, the empirical evidence regarding current property expenditures remains bounded. While the U.S. Department of the Treasury confirms the deceleration of rent inflation to 3.0% through March 2026, the report does not provide corresponding inflation figures for insurance, taxes, or contracted labor. Consequently, while margin compression is an active operational risk under sub-3.3% revenue growth, the actual severity of portfolio-level NOI erosion remains conditional until verified expense data is evaluated.
Debt service coverage and capitalization rates

For multifamily and build-to-rent sponsors, slower rent growth introduces friction into capital structure performance, particularly regarding debt service coverage ratios (DSCR).
DSCR measures net operating income against debt service obligations. When gross revenue expansion moderates to 3.0%, as reported by the U.S. Department of the Treasury, property-level NOI growth slows in tandem, reducing an asset’s ability to cushion elevated borrowing rates. For sponsors managing floating-rate debt or navigating upcoming debt maturities, this decelerated income growth can create financing gaps. Lenders underwriting properties at this 3.0% rate model lower projected cash flows. Meeting standard lender debt coverage thresholds under tighter cash-flow projections may require borrowers to execute cash-in equity injections during refinancing.
This downward shift in growth expectations also affects asset pricing and discounting models. Commercial property valuations rely heavily on cash-flow projections that balance the cost of capital against expected future income expansion. With rent growth resetting to 3.0%, as documented by the U.S. Department of the Treasury, underwriters can no longer justify low entry yields by projecting aggressive organic revenue spikes.
This dynamic exerts upward pressure on going-in capitalization rates and necessitates more conservative, higher terminal exit yields across multi-year hold periods. Because the Treasury release does not report closed transaction data, the precise basis-point expansion in cap rates and the specific scale of required recapitalizations remain uncertain across individual submarkets.
Implications for multifamily assets
The decline of U.S. rent inflation to 3.0% shifts property performance away from pandemic-era pricing power back toward historical revenue patterns. For multifamily real estate, top-line rent increases can no longer be relied upon to mask elevated operational expenses or cushion high borrowing costs. As top-line gains slip below the 3.3% historical benchmark, real estate performance will depend more on operating cost management and conservative capital structures.
Disclaimer: This analysis is for informational purposes only and does not constitute investment, financial, real estate, or legal advice. Always consult a licensed financial advisor before making investment decisions.