
U.S. Mortgage Rates Climb to 7.49% as Treasury Yields Rise
How rising benchmark yields are pressuring mortgage rates and borrower demand
Upward pressure in benchmark U.S. Treasuries has driven the average 30-year fixed mortgage rate to its highest level since late 2023, reducing overall loan applications and prompting a sharp decline in refinancing.
Bond market transmission to mortgage rates
Long-term residential mortgage rates track the 10-Year U.S. Treasury yield, which is the primary benchmark for pricing fixed-rate mortgage-backed securities. When sovereign debt yields climb, the baseline cost of capital rises across consumer credit markets.
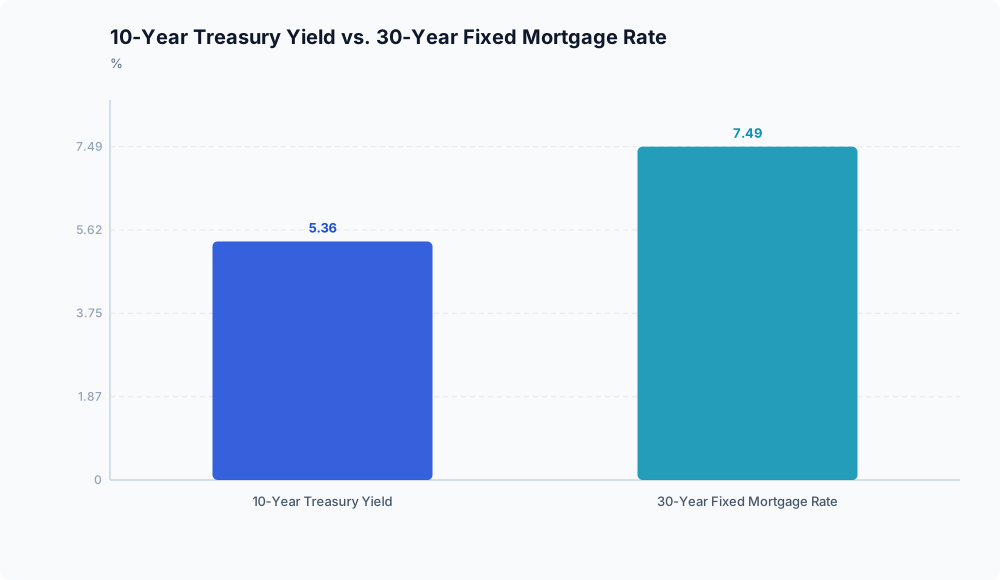
According to market commentary from Sun West Mortgage Company, Inc., the 10-Year Treasury yield rose 8.10 basis points from its prior close of 5.2793% to 5.3603%. Because lenders price 30-year fixed loans at a spread above sovereign debt to account for prepayment and credit risks, that upward movement pushed consumer borrowing rates higher.
For the week ended October 2, the average 30-year fixed mortgage rate climbed 19 basis points to 7.49%, its highest level since November 2023, as reported by Sun West Mortgage Company, Inc.. While mortgage rates do not shift in exact lockstep with Treasuries day to day, sustained yield growth leads lenders to adjust rate sheets upward to protect investor returns.
Borrower demand pulls back unevenly
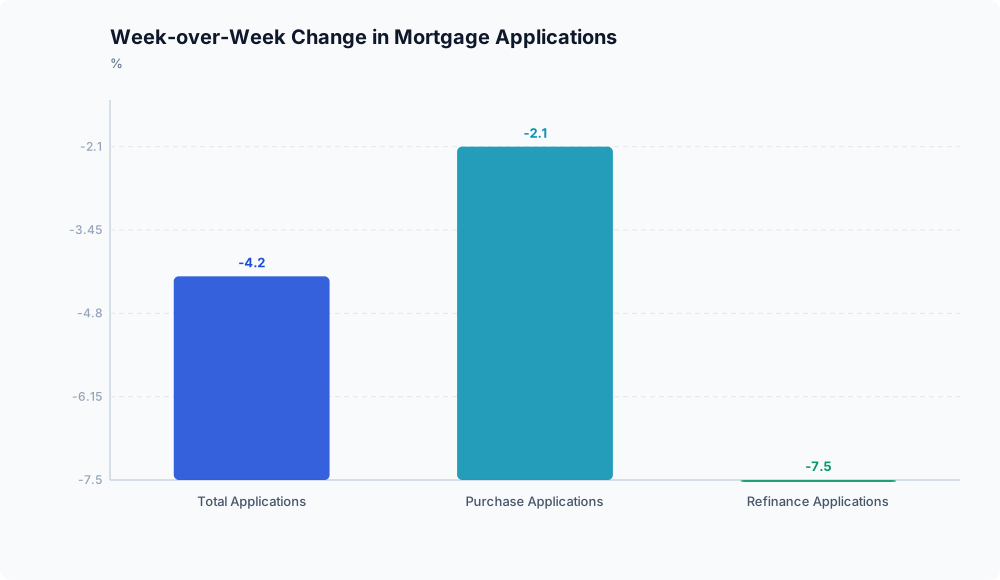
With rates reaching 7.49%, overall lending activity contracted. Data published by Sun West Mortgage shows that total mortgage applications declined 4.20% week-over-week.
The pullback varied by loan type. According to Sun West Mortgage Company, Inc., refinance applications dropped 7.50% week-over-week, while home purchase applications fell 2.10% over the same period.
This split reflects differing sensitivity to borrowing costs. Refinancing is largely discretionary; as prevailing rates climb toward multi-year peaks, the pool of homeowners who can lower their monthly payment shrinks rapidly.
Purchase demand remained steadier. While that contraction points to affordability pressures for prospective buyers, purchase applications are partly sustained by life events and relocations that occur regardless of credit conditions.
Transaction velocity and homebuilder dynamics

Lower purchase and refinance volume slows business for originators, title agencies, and brokerages that depend on completed transactions. The available reporting tracks weekly application counts, however, and does not quantify dollar revenue losses or margin contractions for individual settlement service providers.
Financing costs near 7.50% also reinforce the “lock-in effect” in the resale market, as current homeowners holding lower interest rates avoid listing their properties.
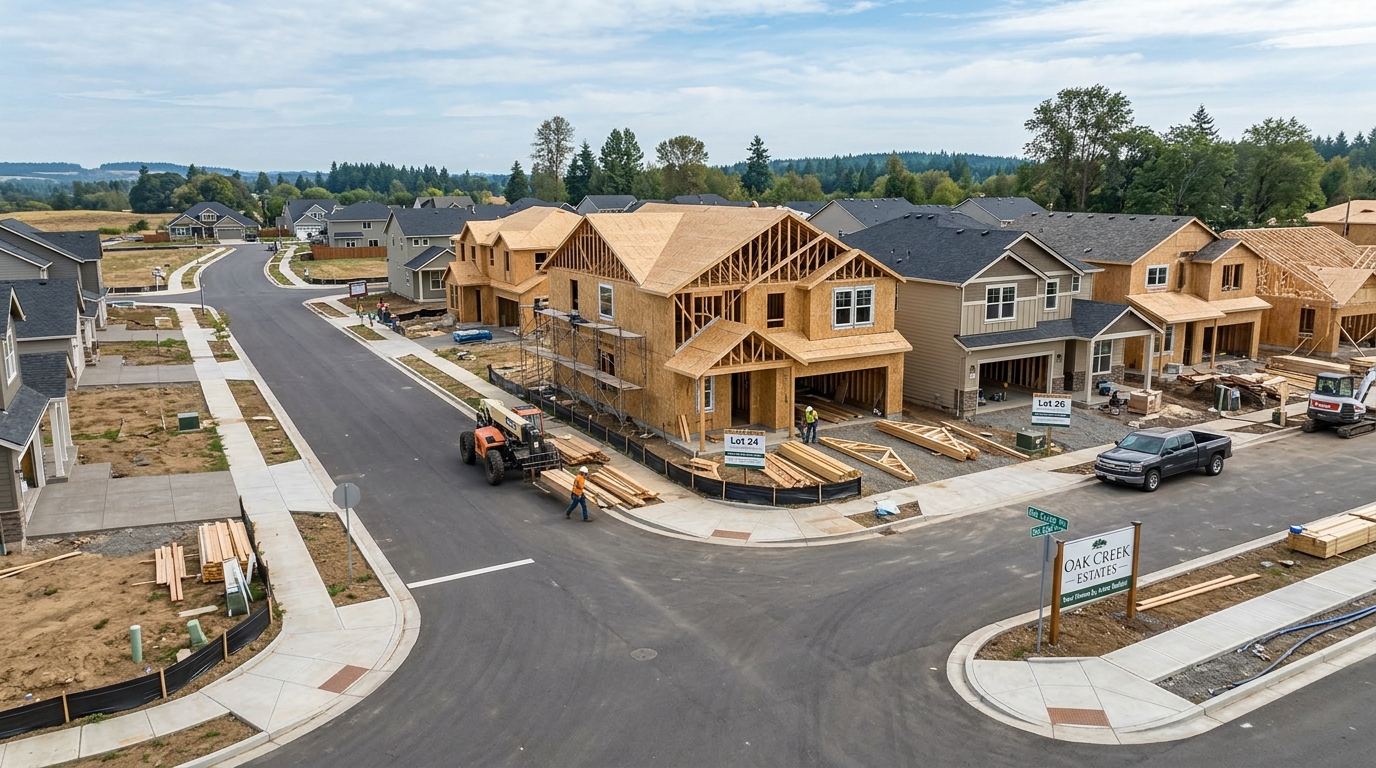
That dynamic directs prospective buyers toward new construction, making homebuilders a central source of available inventory. To attract buyers facing elevated mortgage rates, builders frequently use financing incentives such as permanent rate buydowns and forward commitments. As market rates rise, subsidizing borrowing costs becomes more expensive for builders, weighing on gross margins. Because available macro data does not track builder concession metrics, the exact financial impact on builder margins remains unmeasured for this period. Until benchmark yields stabilize, transaction activity across lending and resale markets is likely to remain constrained by these borrowing costs.
Disclaimer: This analysis is for informational purposes only and does not constitute investment, financial, real estate, or legal advice. Always consult a licensed financial advisor before making investment decisions.