
Fed Rate Hike: Equity Discount Rates and Stock Valuations
How the Fed’s rate hike reshapes equity discount rates and valuations
The Federal Reserve’s unanimous decision to raise the target range for the federal funds rate increases the baseline risk-free rate, lifting the discount rates applied in equity valuation models such as discounted cash flow (DCF) frameworks and the capital asset pricing model (CAPM). Higher discount rates reduce the present value of future corporate cash flows, compressing justified price-to-earnings (P/E) multiples across equity markets.
The macroeconomic catalyst for policy tightening
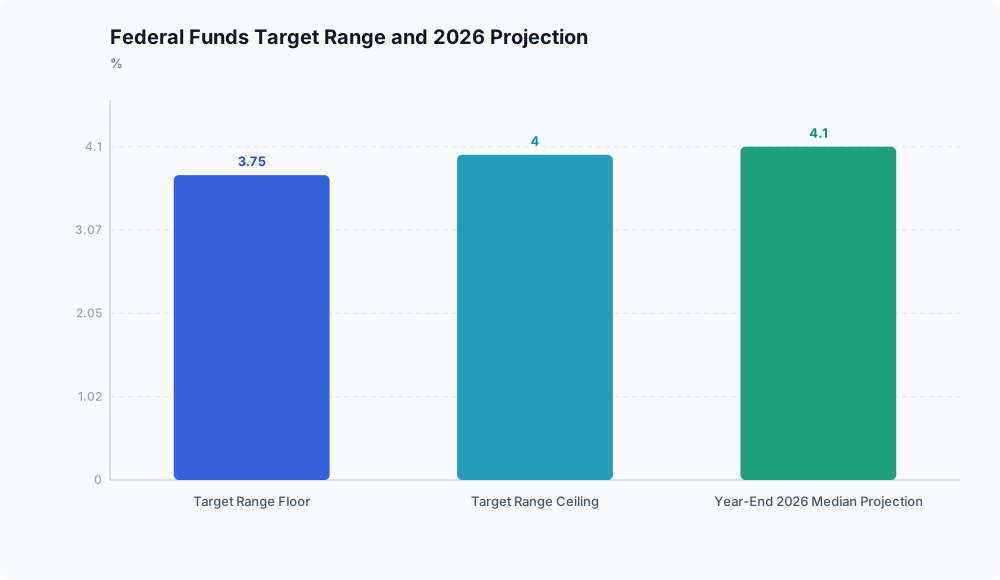
On September 16, 2026, the Federal Reserve voted 12 to 0 to raise the federal funds target range to 3.75% to 4.00%, restarting monetary tightening, according to Crestwood Advisors. The unanimous vote showed consensus among policymakers that prevailing economic conditions warranted additional policy restraint.
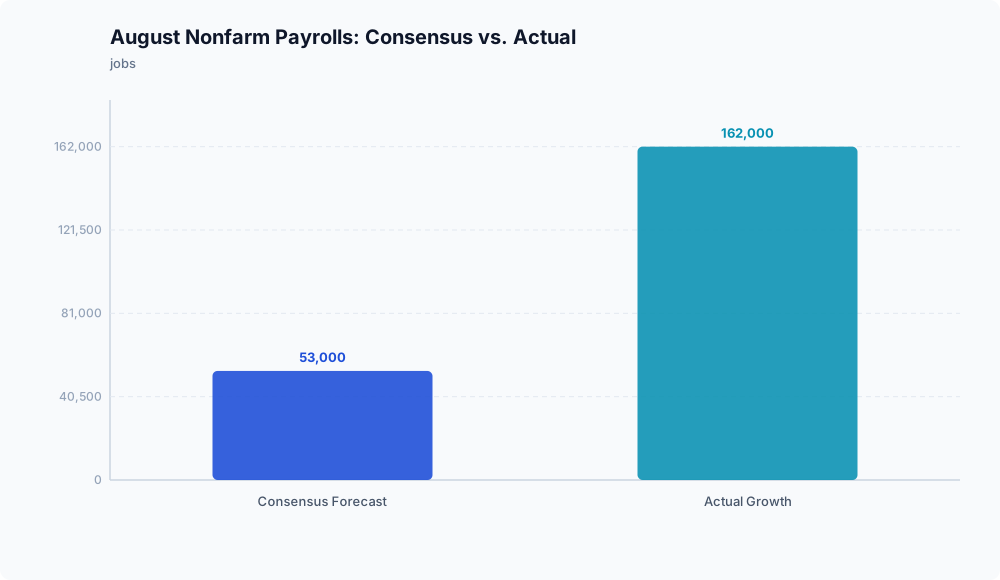
The policy shift followed macroeconomic data pointing to persistent price pressures alongside a resilient labor market. As reported by Crestwood Advisors, U.S. nonfarm payrolls grew by 162,000 in August, above the consensus forecast of 53,000, while the unemployment rate remained at 4.1%. Headline Consumer Price Index (CPI) inflation rose 0.4% month-over-month and 3.4% year-over-year. These figures showed that job growth gave the central bank latitude to target inflation without immediately causing employment to contract.
Policymakers also signaled that policy restraint would continue. According to Crestwood Advisors, the median federal funds rate projection among participants reached 4.1% for year-end 2026. While projections in the Summary of Economic Projections are not binding commitments, they show that committee members anticipated an extended tightening path.
Valuation mechanics and discount rate expansion
When the Federal Reserve lifts its policy rate, benchmark risk-free yields rise across the financial system. In equity valuation models, higher yields raise the hurdle rate applied to future corporate earnings. Because cash received years into the future is worth less in present terms under a higher discount rate, higher benchmark yields mechanically reduce justified equity multiples.
This dynamic creates distinct pressures across equity sectors. High-duration equities, such as growth and technology firms that expect the bulk of their cash flows in distant years, see those future receipts heavily discounted, putting downward pressure on P/E multiples. Cyclical companies face higher hurdle rates alongside potential demand slowdowns as restrictive monetary policy tempers economic activity.
Analytical takeaways and evidentiary boundaries


Strong macroeconomic performance can create competing effects for equity prices. While solid employment numbers point to near-term economic stability, they allow the central bank to keep interest rates elevated, increasing the drag from higher discount rates.
Financial theory indicates that elevated risk-free yields compress valuation multiples, but the underlying source data does not report empirical sector-level P/E ratios, realized equity index returns, or corporate earnings revisions. Sector-specific valuation changes in this context remain a deduction based on valuation models, not an empirically observed outcome in the source data.
Disclaimer: This analysis is for informational purposes only and does not constitute investment, financial, real estate, or legal advice. Always consult a licensed financial advisor before making investment decisions.