
How Apartment Completions Fuel Multifamily Rent Disinflation
How Regional Apartment Completions Drive Multifamily Rent Disinflation
Does the current surge in apartment completions immediately cool nationwide shelter inflation?
In short: No. While an unprecedented wave of new apartment deliveries is driving localized multifamily rent disinflation and lifting vacancy rates, its downward pressure takes considerable time to appear in official macroeconomic inflation gauges. This delay stems from the structural lag between real-time market rents on newly completed units and the staggered renewal cycles of existing tenant leases.
Here is an analysis of what localized delivery peaks in key markets show, how they affect property operations, and why their macroeconomic impact remains gradual.
Local Supply Crests: Columbus and Charlotte
Physical apartment construction financed and permitted in prior years is now hitting the market, pushing regional vacancies upward and softening pricing power across major hubs.
In Columbus, trailing 12-month deliveries reached 9,472 units through the second quarter of 2026, marking an all-time peak for the metropolitan area, according to Realist Capital. This historic influx raised Columbus multifamily vacancy to 10.2% in 2026 Q2—200 basis points above the national average. Forward projections suggest the local delivery wave is cresting rather than accelerating indefinitely: CoStar forecasts that the Columbus vacancy cycle will hold at its peak of 10.2% in 2026 Q3 (Realist Capital).
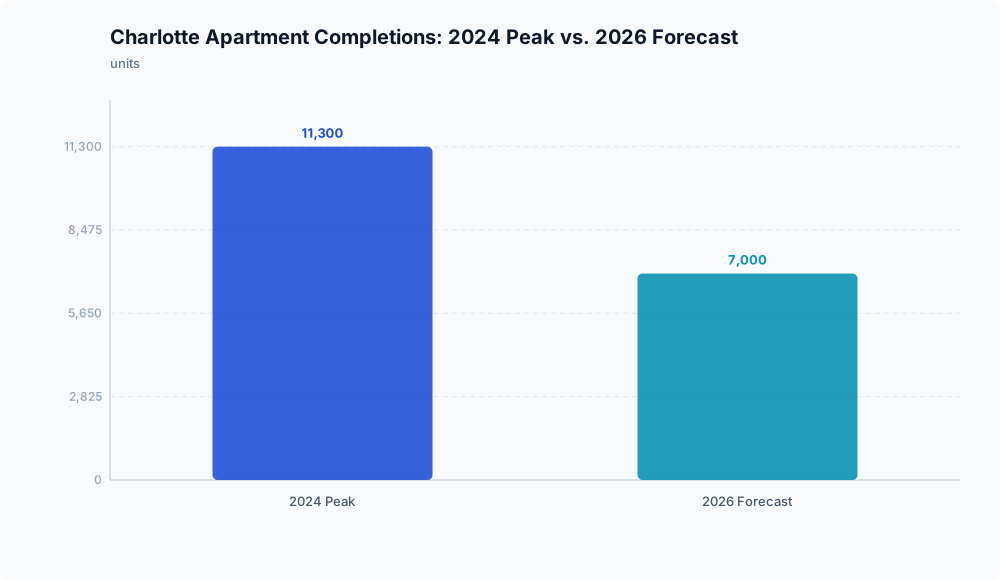
A parallel trend is unfolding across high-growth Sun Belt markets, though forward supply pipelines are already beginning to thin. In the Charlotte metropolitan statistical area, metro-wide vacancy climbed 90 basis points year-over-year to 8.2% in Q1 2026, with Class A multifamily cap rates trading between 5.1% and 5.7%, as reported by Neiboroughly. Upcoming deliveries in Charlotte are projected to moderate significantly: Neiboroughly forecasts approximately 7,000 completions in 2026, representing a 38% decrease from the 2024 peak of 11,300 units.
| Market | Metric / Period | Observation / Forecast | Source |
|---|---|---|---|
| Columbus | Deliveries (trailing 12 months to 2026 Q2) | 9,472 units (all-time peak) | Realist Capital |
| Columbus | Vacancy Rate (2026 Q2) | 10.2% (200 bps above national average) | Realist Capital |
| Columbus | Vacancy Forecast (2026 Q3) | Projected cycle peak at 10.2% (CoStar) | Realist Capital |
| Charlotte | Vacancy Rate (2026 Q1) | 8.2% (+90 bps from 2025 Q1) | Neiboroughly |
| Charlotte | Class A Cap Rates (2026 Q1) | 5.1% to 5.7% | Neiboroughly |
| Charlotte | Delivery Forecast (2026) | ~7,000 units (-38% vs. 2024 peak of 11,300) | Neiboroughly |
Operational Friction and the Shelter Transmission Lag
The divergence between on-the-ground rental dynamics and macroeconomic shelter indicators is rooted in two operational factors:
- Defensive Leasing Strategies: When vacancies plateau at elevated levels—such as the double-digit rates recorded in Columbus—operators face prolonged absorption drag. To protect occupancy, property managers often deploy concessions and leasing incentives. These incentives compress effective rent growth even if gross scheduled asking rents appear relatively stable on paper.
- Contract Lease Staggering: New inventory immediately affects the price of available, unleased units. However, official shelter inflation indexes measure rent paid across all occupied housing, the majority of which is locked into annual contracts. It takes months of lease renewals for softer market-rate pricing to replace older, higher contract rents.
While localized evidence points toward property-level net operating income (NOI) compression from persistent vacancies and rent disinflation, direct REIT portfolio performance and aggregate nationwide concession totals are not established in this data. The severity of operator margin compression will largely depend on specific submarket delivery schedules.
Macroeconomic Outlook and Policy Limits
Because tenant rents and owner-equivalent rent constitute a substantial share of core consumer price indices, sustained rental softening helps dismantle a major driver of post-pandemic inflation stickiness. As asking rents soften under the weight of regional supply waves, the eventual pass-through into broader inflation readings should help anchor long-term inflation expectations and stabilize benchmark borrowing yields.
However, localized supply data does not translate into guaranteed interest rate reductions. The documented evidence reflects micro-market conditions in specific hubs like Columbus and Charlotte—not official Bureau of Labor Statistics survey panels or Federal Reserve reaction functions.
While easing rental markets remove an upward catalyst for core inflation, central bank policy depends on broader macroeconomic conditions, including non-housing services inflation and overall financial conditions. A cresting apartment delivery wave creates the necessary conditions for shelter disinflation, but it does not guarantee immediate central bank rate cuts or lower mortgage rates.
Conclusion

The evidence from bellwether markets demonstrates that the multifamily supply wave is reaching its operational inflection point. As completions crest in markets like Columbus and pipeline activity contracts from previous highs in Charlotte, elevated vacancies are constraining rent growth at the property level.
For real estate operators and macroeconomic observers, this means the disinflationary impulse from new construction is real and functioning as expected—yet its arrival in aggregate inflation metrics and central bank policy decisions will remain a slow, staggered process governed by contractual lease renewal cycles.
Disclaimer: This analysis is for informational purposes only and does not constitute investment, financial, real estate, or legal advice. Always consult a licensed financial advisor before making investment decisions.