
Mortgage Rates and Shelter Disinflation: Capital Cost Trends
Mortgage rates and debt financing: assessing the impact of tightening yields
Benchmark 30-year fixed conforming mortgage rates crossed back above 7.00% in September 2026 following an interest rate hike by the Federal Reserve and subsequent yield increases across long-duration U.S. Treasuries, according to reporting by ecmsource.com. For borrowers and leveraged real estate investors, this environment establishes an elevated baseline cost of capital that increases ongoing debt service requirements.
Catalysts behind the surge above 7.00%
On September 16, 2026, the Federal Open Market Committee raised the federal funds target rate by 25 basis points, as reported by ecmsource.com.
Conforming 30-year mortgages are long-term instruments that do not directly track overnight policy rates, but the rate increase prompted markets to price in persistent core inflation. Those expectations pushed intermediate and longer-term fixed-income benchmarks higher.
By the close of trading on Friday, September 18, 2026, daily benchmark 30-year fixed conforming mortgage rates rose above 7.00%, averaging between 7.05% and 7.12% across national lending surveys, according to reporting by ecmsource.com.
Long-duration sovereign yields anchor capital costs
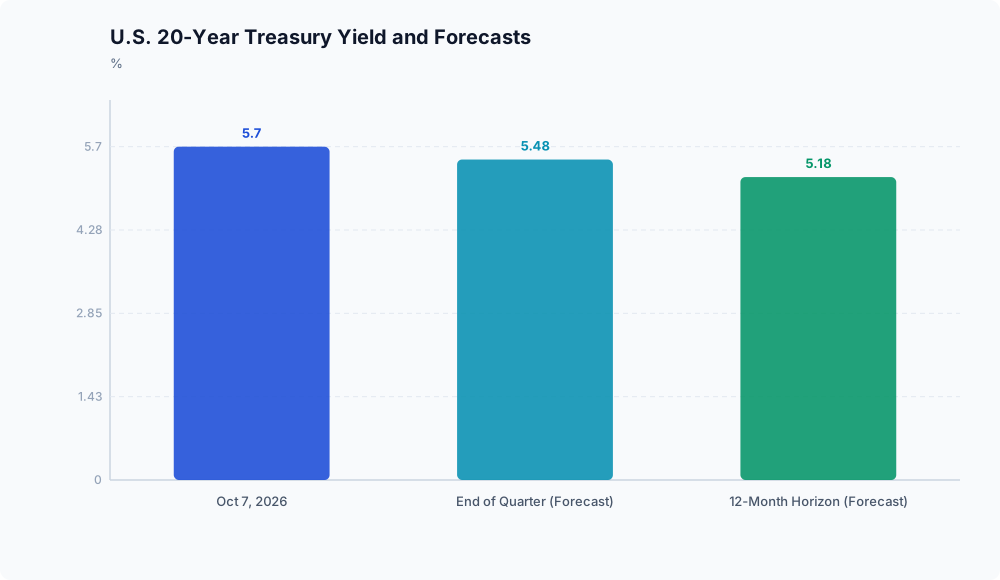
The upward pressure on borrowing costs extended into the autumn across the long end of the U.S. yield curve. Over-the-counter interbank data reported by Trading Economics recorded the yield on the U.S. 20-year bond rising to 5.70% on October 7, 2026, a 0.02 percentage point daily increase.
Because lenders price residential mortgages at a spread above government debt, yields at these levels limit near-term relief for home financing. Elevated sovereign yields also raise hurdle rates across the broader financial system, constraining liquidity and debt affordability.
Model projections from Trading Economics forecast the U.S. 20-year bond yield to trade at 5.48% by the end of the quarter and ease to 5.18% over a 12-month horizon. If long-term yields moderate toward those forecast levels, mortgage borrowing costs could decrease gradually. Potential relief remains conditional on broader secondary market conditions and whether mortgage spreads over sovereign debt normalize.
Debt service pressures and analytical limits


Borrowing costs anchored above 7.00% increase debt service requirements for leveraged property investments, as documented by ecmsource.com. Under these elevated capital costs, property financing requires significant operational margins to service existing debt loads.
Regarding how these financing benchmarks intersect with broader housing costs and shelter disinflation, available market evidence only tracks sovereign yields and mortgage interest rate levels. The supplied data does not report empirical metrics for rent price indexes, commercial capitalization rates, or the deceleration of shelter inflation.
Primary mortgage and Treasury market data document the direct financing burden, but assessing broader shelter cost trajectory changes remains outside the scope of verified yield reports. Residential debt financing faces ongoing friction from tight monetary policy and long-end sovereign yields holding near elevated levels until secondary market spreads normalize.
Disclaimer: This analysis is for informational purposes only and does not constitute investment, financial, real estate, or legal advice. Always consult a licensed financial advisor before making investment decisions.