
10-Year Treasury Yield 5.34%: Drivers and Valuation Impact
What caused the 10-year Treasury yield to reach 5.34%, and how does it affect valuations?
The 10-year US Treasury yield surged to an intraday high of 5.34% in early October 2026 primarily because financial markets priced in an aggressive monetary tightening path of roughly three interest rate hikes over the following year, reinforced by strong earlier nominal economic output and a September Federal Reserve rate increase, according to UBS. This spike resets the foundational discount rate across asset classes, compressing equity valuation multiples, particularly for long-duration growth stocks, and elevating refinancing costs for corporate borrowers.
Macro drivers: policy tightening against mixed economic signals
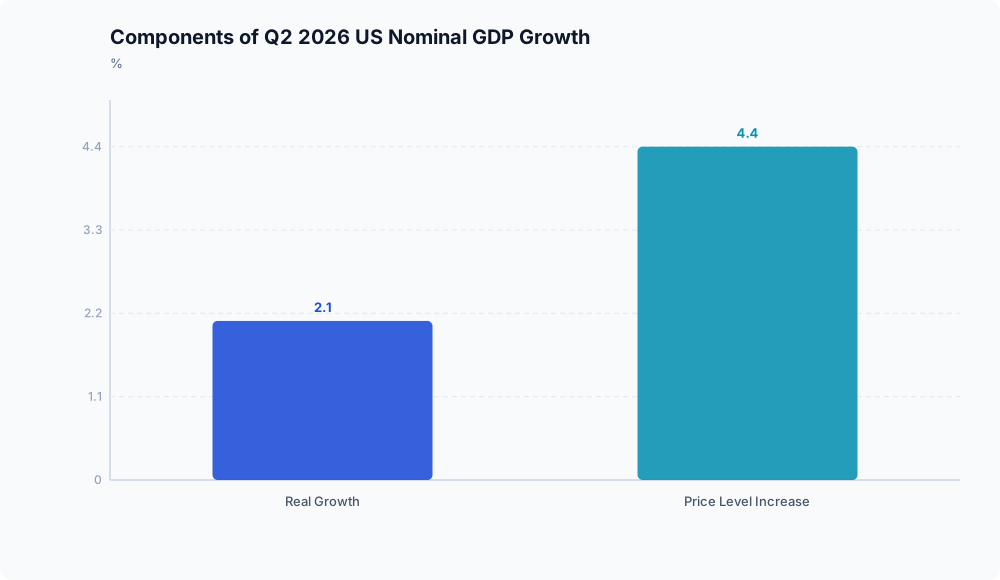
The run-up in the 10-year Treasury yield to 5.34%, its highest intraday mark since 2002, reflected an environment shaped by elevated nominal activity and sustained central bank tightening, according to UBS. In September 2026, the Federal Open Market Committee (FOMC) lifted the federal funds target rate by 25 basis points, as documented by UBS. This policy move followed strong baseline output: at the end of the second quarter of 2026, US nominal GDP expanded at an annualized year-over-year rate of 6.6%, comprising roughly 2.1% real growth and a 4.4% rise in the broad price level, per UBS. That nominal base encouraged fixed-income investors to demand greater term compensation into early autumn.
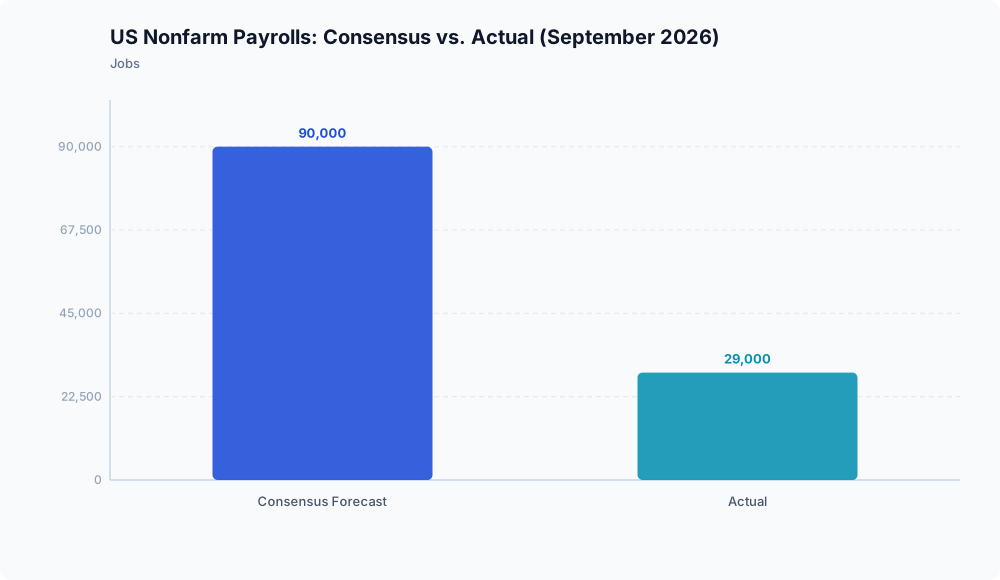
Yet this surge occurred alongside incoming data pointing to cooling momentum. In August 2026, the three-month annualized rate of US core personal consumption expenditures (PCE) inflation fell to 2.05%, its lowest reading since July 2024, while September 2026 nonfarm payrolls rose by only 29,000, missing the consensus forecast of 90,000, according to UBS.
Market expectations vs. institutional projections
The tension between softening economic data and climbing yields points to a split between broader market pricing and institutional forecasts. While financial markets were pricing in approximately three rate increases over the next 12 months, UBS projected only a single 25-basis-point increase in December 2026, pointing to decelerating labor demand and moderating inflation as reasons the Fed would slow its pace.
This divergence suggests that the rise to 5.34% stemmed more from market participants bracing for an extended tightening cycle than from accelerating economic growth. If actual policy matches a single December hike rather than the three increases priced by traders, benchmark yields could face downward recalibration once market expectations adjust to incoming economic softness.
Valuation pressures on equities and corporate balance sheets

The 10-year Treasury yield serves as the foundational risk-free rate used to discount projected corporate cash flows. The run-up to 5.34%, marking its highest intraday level since 2002 as reported by UBS, elevates hurdle rates across the capital structure. Furthermore, sharp yield spikes cause the equity risk premium to plunge, according to Investing.com. Long-duration growth equities face significant multiple compression because their valuations rely heavily on cash flows expected far into the future, which are diminished when discounted at higher rates.
Elevated benchmark yields also alter corporate debt fundamentals. Although UBS projects S&P 500 earnings growth of 25% in 2026 and 14% in 2027, supported by the nominal GDP expansion of 6.6% recorded at the end of Q2 2026, the capacity to navigate higher borrowing costs varies widely across corporate America. Businesses with low leverage and substantial liquidity reserves remain largely insulated from refinancing headwinds and can capture meaningful yields on their cash balances. In contrast, companies needing near-term debt refinancing must issue new paper at coupons far higher than their legacy debt, risking interest expenses that could erode free cash flows and compress margins.
Because comprehensive data detailing specific sub-sector equity risk premiums is not available, the precise degree of valuation divergence between individual industries remains an open variable.
Market outlook

The move to a 5.34% 10-year Treasury yield reflects a bond market priced for persistent monetary hawkishness, even as labor and inflation prints show clear signs of deceleration. For investors and corporate managers, strong top-line nominal growth will no longer lift all valuations equally. As long as risk-free hurdle rates hover near multi-decade highs, balance sheet strength and near-term cash generation will serve as the dividing line between firms that can absorb elevated capital costs and those vulnerable to margin contraction.
Disclaimer: This analysis is for informational purposes only and does not constitute investment, financial, real estate, or legal advice. Always consult a licensed financial advisor before making investment decisions.