
Fed Policy Tightening and Equity Multiple Compression
How Fed policy tightening drives equity multiple compression
How does Federal Reserve policy tightening compress equity valuation multiples across financial markets?
When the Federal Reserve raises benchmark interest rates, it elevates baseline risk-free yields across the yield curve. Because equity valuations discount projected cash flows back to the present, a higher discount rate reduces the present value of those distributions. This dynamic exerts downward pressure on equity valuation multiples, such as forward price-to-earnings ratios, with a pronounced impact on long-duration growth companies whose cash flows are concentrated years in the future.
On September 16, 2026, the Federal Reserve voted 12 to 0 to raise the target range for the federal funds rate to 3.75% to 4.00%, as reported by Crestwood Advisors. The unanimous vote reflected a shared intent among central bankers to curb persistent price pressures while macroeconomic demand remained resilient.
Macroeconomic catalysts behind the rate increase
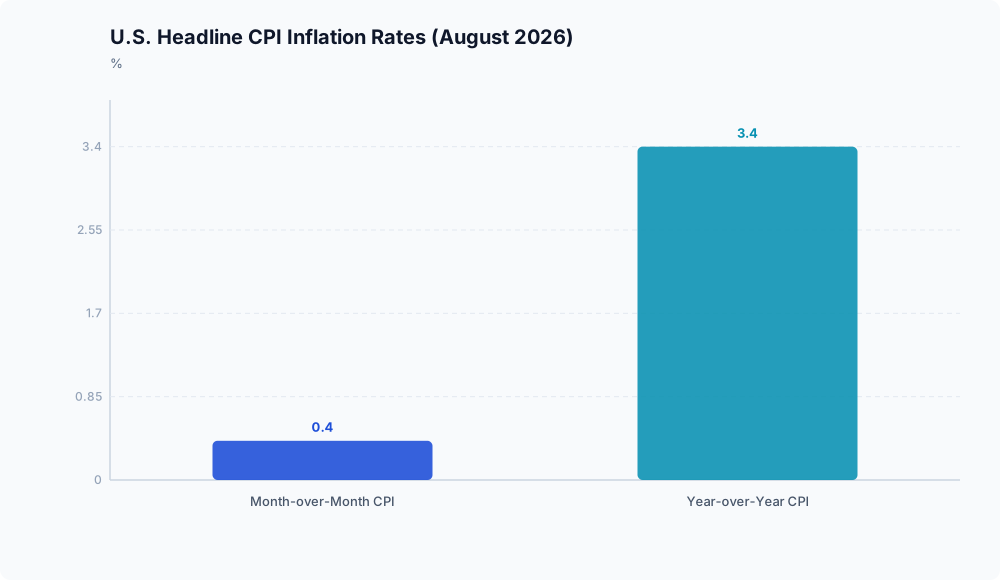
The Fed’s decision came as inflation remained above historical baselines and the broader economy continued to expand. According to Crestwood Advisors, U.S. headline Consumer Price Index (CPI) inflation rose 0.4% month-over-month and stood at 3.4% year-over-year in August 2026. This ongoing price momentum indicated that consumer inflation was proving stubborn, supporting the central bank’s choice to remove monetary accommodation.
The domestic labor market also gave policymakers room to raise borrowing costs without triggering an immediate labor downturn. The Bureau of Labor Statistics reported that U.S. nonfarm payrolls expanded by 162,000 positions in August 2026, as documented by Crestwood Advisors. Steady job additions alongside elevated inflation confirmed that domestic economic activity remained sturdy enough to absorb a higher funds rate.
The mathematical transmission to equity multiples
Monetary tightening transmits into financial assets through standard discounted cash flow (DCF) frameworks and the capital asset pricing model. In these valuation models, the risk-free rate establishes the benchmark for the weighted average cost of capital (WACC), which functions as the discount rate ($r$). When the central bank raises its policy range, the resulting upward shift in risk-free yields increases the denominator in corporate valuation formulas.
This adjustment affects long-duration assets most heavily. Future cash flows occurring in period $t$ are discounted by the factor $(1 + r)^t$. As $t$ increases, an upward change in $r$ exponentially reduces present value. Consequently, growth companies, whose value rests primarily on earnings projected far into the future, face steeper multiple compression than mature firms delivering near-term cash returns. While financial theory dictates this inverse relationship between discount rates and multiples, the realized magnitude of multiple compression across specific market sectors remains an empirical variable not quantified in the baseline data.
Sovereign yield repricing, corporate debt, and banking dynamics
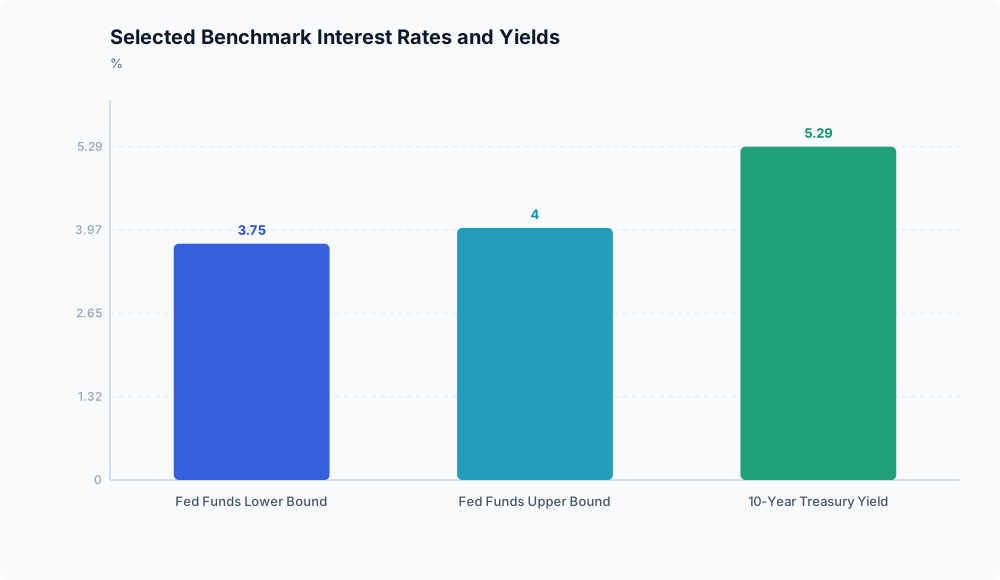
The tightening of short-term policy rates coincided with substantial repricing across longer-dated sovereign debt. The 10-year U.S. Treasury yield concluded the third quarter of 2026 at 5.29%, occurring alongside U.S. federal debt surpassing $40 trillion in August 2026, a level representing roughly 125% of gross domestic product, as reported by Kavar Capital Partners.
This repricing alters corporate capital structures as outstanding debt matures:
- Debt obligations originally issued during lower-rate regimes must theoretically be rolled over at benchmark rates above 5%, raising baseline interest burdens.
- Corporate operating performance partially counterbalances this debt servicing pressure; analysts forecast S&P 500 earnings per share to reach roughly $363.50 in 2026, reflecting a 34.3% year-over-year increase, according to Kavar Capital Partners.
- Because sector-level rollover schedules and effective borrowing spreads are not recorded in the data, the exact degree of corporate credit stress remains an analytical assessment rather than a measured outcome.
Commercial banking institutions face mixed pressures under this monetary backdrop. Benchmark policy rates at 3.75% to 4.00%, reported by Crestwood Advisors, lift yields on floating-rate loans, supporting gross asset income. However, a 10-year Treasury yield of 5.29%, documented by Kavar Capital Partners, simultaneously accelerates funding competition, forcing financial institutions to offer higher deposit yields to retain capital. Because regulatory filings, deposit betas, and net interest margins (NIMs) are absent from the record, the net trajectory of bank profitability under these conditions remains subject to empirical uncertainty.
Analytical takeaway
Monetary policy directly constrains asset pricing through the mathematical mechanics of discounting. When resilient employment and above-target inflation push sovereign yields higher, valuation multiples contract unless offset by substantial corporate earnings growth. For investors and capital allocators, navigating Fed policy tightening requires balancing theoretical multiple compression against projected earnings resilience.
Disclaimer: This analysis is for informational purposes only and does not constitute investment, financial, real estate, or legal advice. Always consult a licensed financial advisor before making investment decisions.
Frequently asked questions

Why are high-growth equities more vulnerable to multiple compression than value stocks during Fed tightening?
High-growth equities derive most of their enterprise value from projected earnings expected far in the future. In valuation frameworks, cash flows occurring at distant intervals are discounted by $(1 + r)^t$. Because the time horizon ($t$) is long, an increase in the discount rate ($r$) geometrically reduces the present value of those distant cash flows, causing market multiples to contract more aggressively than those of companies with immediate, realized cash flows.

How does elevated inflation at 3.4% YoY limit the Federal Reserve’s ability to lower discount rates in the near term?
Headline CPI inflation of 3.4% year-over-year demonstrates that price growth remains elevated above historical baselines. Lowering the federal funds rate prematurely would ease financial conditions and risk reigniting consumer demand, which could entrench inflationary pressures. Consequently, the central bank maintains restrictive rates, keeping upward pressure on market discount rates until price stability is restored.