
Fed Hike Dynamics: How Rates Pressure Equity Valuations
How the Fed’s Policy Resumption Pressures Equity Valuations
How does the Federal Reserve’s return to interest rate hikes affect equity valuations and capital costs?
In short: Raising benchmark interest rates directly elevates the risk-free rate used in financial valuation models, mechanically lifting the cost of equity and increasing the hurdle rate for future cash flows. This dynamic reduces the present value of projected corporate earnings, exerting downward pressure on equity price-to-earnings (P/E) multiples—particularly for long-duration growth assets—unless offset by accelerating earnings growth.
Here is an analysis of the macroeconomic forces driving the Federal Reserve’s policy shift, the valuation mechanics at play, and the empirical boundaries of the current market data.
The Policy Shift: What Catalyzed the Fed’s Move?
On September 16, 2026, the Federal Open Market Committee (FOMC) voted 12 to 0 to raise the federal funds target range to 3.75% to 4%, as reported by Crestwood Advisors. This unanimous decision ended an extended policy pause, marking the central bank’s first rate increase since July 2023 and confirming a broad institutional consensus that monetary conditions needed further tightening.
The rate hike was spurred by resilient domestic economic data that diminished concerns over a near-term growth slowdown:
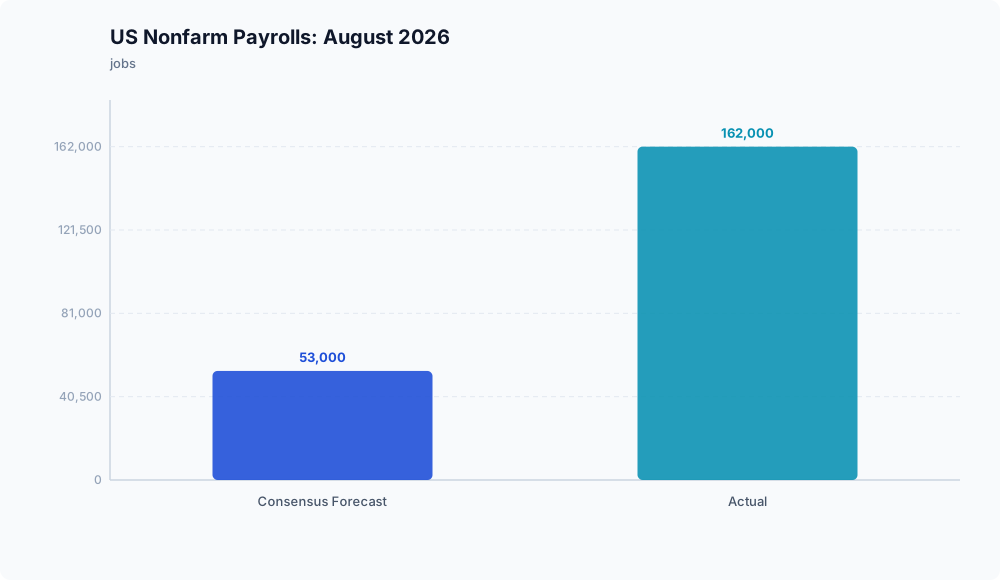
- Labor Market Strength: Nonfarm payrolls expanded by 162,000 jobs in August 2026, far outpacing the consensus forecast of 53,000, according to Crestwood Advisors. Job creation at triple the expected pace indicated robust employment momentum.
- Persistent Inflation: The US Consumer Price Index (CPI) rose 0.4% month-over-month and 3.4% year-over-year in August 2026, matching consensus expectations, as cited by Crestwood Advisors. While not an upside surprise, the 3.4% annual rate demonstrated that disinflation had stalled well above the central bank’s target.
Rather than treating the move as an isolated adjustment, policymakers projected sustained restraint. According to Crestwood Advisors, the median year-end 2026 federal funds rate projection in the September Summary of Economic Projections (SEP) reached 4.1%, with 16 of 18 participating committee members projecting at least one additional hike before the end of the year.
Valuation Mechanics: Discount Rates and Equity Multiples
In equity valuation models, risk-free benchmark yields form the foundation of the discount rate. When baseline policy rates move higher, the hurdle rate applied to future corporate cash flows rises proportionately through the cost of equity.
Mechanically, an upward shift in discount rates exerts downward mathematical pressure on broad-market P/E multiples. Future cash flows become less valuable in today’s dollars, meaning equity valuations must compress unless companies deliver equivalent accelerations in long-term earnings growth.
This environment alters capital allocation in two distinct ways:
- Long-Duration Equities: Growth equities with cash flows concentrated further into the future face disproportionate discounting compared to near-term cash-generative businesses.
- Capital-Intensive Projects: Initiatives funded by corporate borrowing face steeper hurdle rates to generate returns above borrowing costs now anchoring toward a 4.1% policy benchmark, as outlined by Crestwood Advisors.
Analytical Caveats: What the Data Does Not Show

While the directional relationship between policy rates and discount rates is mathematically direct, the scope of the available data leaves several market metrics unquantified.
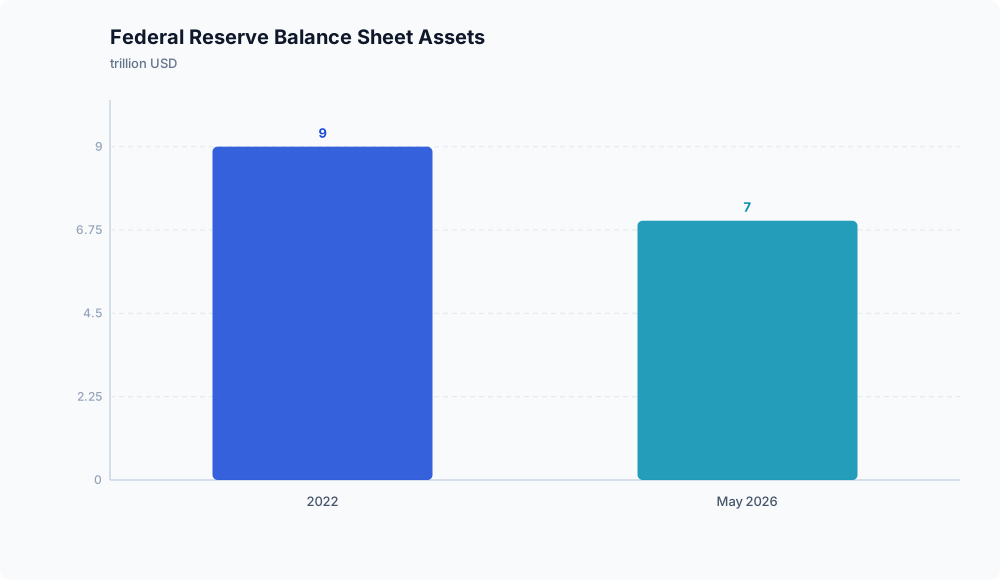
Specifically, the reporting from Crestwood Advisors establishes the macroeconomic indicators and policy forecasts, but it does not specify the exact yield level for the 10-year Treasury note or measure the realized decline in equity index P/E multiples. Furthermore, while Charles Schwab documents the Federal Reserve’s balance sheet reduction from nearly $9 trillion to roughly $7 trillion, the reporting lacks firm-level capital allocation statistics or corporate debt issuance figures for specific market segments, such as enterprise artificial intelligence or infrastructure investments.
While financial theory indicates that an increasing cost of capital compresses profit margins on debt-financed investments, empirical conclusions regarding the exact extent of capital expenditure cuts or equity re-ratings remain unestablished by the current data.
Key Takeaway

The Federal Reserve’s September 2026 rate hike confirms that monetary policy has re-entered a tightening phase driven by sticky 3.4% inflation and resilient labor figures, as reported by Crestwood Advisors. For market participants, this environment establishes that capital costs will remain elevated above 4% through at least year-end based on the 4.1% median year-end policy projection cited by Crestwood Advisors. Consequently, equity valuations face sustained mathematical headwinds, requiring stronger underlying earnings performance to justify prevailing multiples in a higher-discount-rate environment.
Disclaimer: This analysis is for informational purposes only and does not constitute investment, financial, real estate, or legal advice. Always consult a licensed financial advisor before making investment decisions.